The Beveridge curve, developed in the UK back in 1958, compares job vacancies as a fraction of total labor force with the unemployment rate. It allows one to study, among other things, labor inefficiency and labor mobility. If there are job openings in one part of the country or one industry, but the unemployed are unable to fill those openings due to geographical or skill mobility constraints, the Beveridge curve would show it.
Barclays Capital has recently looked at the Beveridge Curve for the US. The curve "regime" has shifted significantly in the post-recession environment.
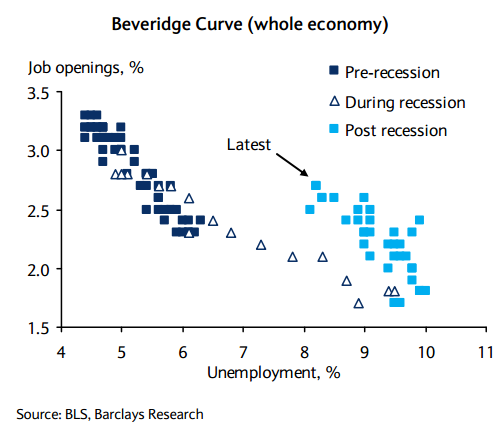
With the current job openings number, the unemployment would have been at 5.5% on the pre-recession curve, but it clearly isn't. What does this tell us?
This looks like a structural shift rather than a cyclical adjustment, with a completely new "equilibrium" level. That's why the Fed now believes that the new "natural" unemployment rate is closer to 6.7% rather than the 5% prior to the recession. This fact is critical as the Fed adjusts the monetary policy. If the unemployment rate begins to approach 6.7% (not the pre-recession 5%), the Fed Funds target rate will begin to rise.
So what's the explanation for this shift?
Geographic mobility constraints may explain some of it, as negative home equity makes it difficult for the unemployed to move. Economists however are skeptical that geographic "immobility" could explain the whole shift. If slow migration was the explanation, over time the Beveridge curves should start converging as migration picks up - people walk away from their homes, sell them, or find jobs locally. But so far the pre- and post-recession curves have been diverging.
Some economists point to a cross-sector skills mismatch. For example lost construction jobs may not be replaced with newly created manufacturing jobs because of different skill requirements. But as a fraction of the overall unemployment rate, construction unemployment is roughly back to where it was prior to the recession.
Barclays Capital: - ... sectors which experienced the largest relative increase in unemployment during the recession (particularly construction) have experienced the largest relative decline in the recovery, suggesting that workers laid off in construction have found jobs elsewhere. Indeed, the ratio of the construction sector unemployment rate to the total is now close to pre-recession levels.
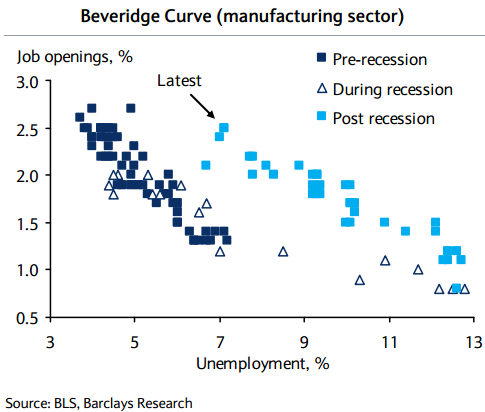
There may be some evidence of a skills mismatch within industries. For example, within the manufacturing sector the Beveridge curves have diverged as well. But have skill requirements in US manufacturing really changed so much during the recession as to generate such a shift?
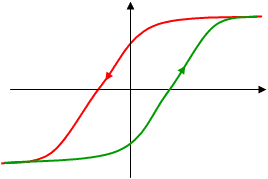
There is a better explanation that points to a structural shift in employment dynamics. Some refer to it as hysteresis. In engineering the phenomena describes a system that responds not just to its current environment, but to the path it took. A thermostat switch will turn on at a different temperature than it turns off to avoid rapid switching. Built-in hysteresis will assure that the switch "event" depends not just on the current temperature but on whether the temperature got there by increasing or decreasing.
It seems that employment dynamics have a built-in hysteresis, driven by the effects of long-term unemployment. Data suggests that the longer someone has been out of work, the longer it takes them to find work.
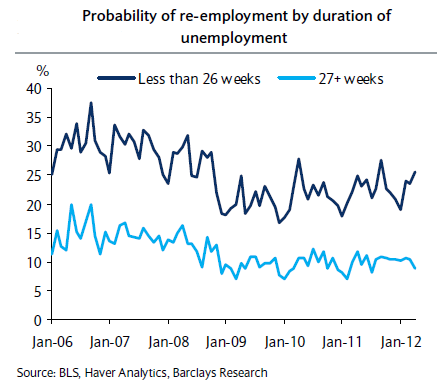
This means that after a deep prolonged recession, as job vacancies rise, they will be filled at a rate different from when jobs were originally lost.
Barclays Capital: - One reason is so-called hysteresis – a term to explain the long-lasting effect of a temporary shock, in this case, how a cyclical jolt to the economy transmits into persistently higher (ie, structural) unemployment. Long-term unemployment is the most powerful channel for this, in our view. In essence, this is because evidence suggests that the longer a person remains unemployed, the less likely they are to re-enter employment .
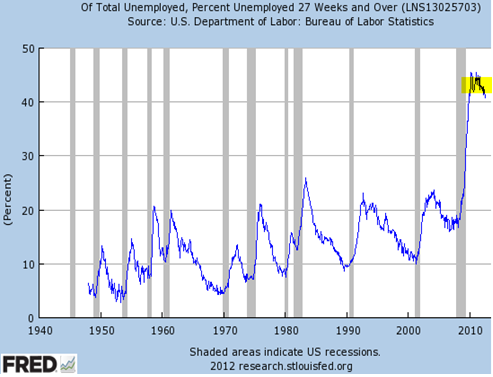
Given that the long-term unemployment has been at record levels (chart below), the structural hysteresis effect is far more pronounced than in the past. The path to recovery on the Beveridge curve is very different from the path of decline. The higher "natural" unemployment rate is here to stay.
Barclays Capital has recently looked at the Beveridge Curve for the US. The curve "regime" has shifted significantly in the post-recession environment.

With the current job openings number, the unemployment would have been at 5.5% on the pre-recession curve, but it clearly isn't. What does this tell us?
This looks like a structural shift rather than a cyclical adjustment, with a completely new "equilibrium" level. That's why the Fed now believes that the new "natural" unemployment rate is closer to 6.7% rather than the 5% prior to the recession. This fact is critical as the Fed adjusts the monetary policy. If the unemployment rate begins to approach 6.7% (not the pre-recession 5%), the Fed Funds target rate will begin to rise.
So what's the explanation for this shift?
Geographic mobility constraints may explain some of it, as negative home equity makes it difficult for the unemployed to move. Economists however are skeptical that geographic "immobility" could explain the whole shift. If slow migration was the explanation, over time the Beveridge curves should start converging as migration picks up - people walk away from their homes, sell them, or find jobs locally. But so far the pre- and post-recession curves have been diverging.
3rd party Ad. Not an offer or recommendation by Investing.com. See disclosure here or remove ads.
Some economists point to a cross-sector skills mismatch. For example lost construction jobs may not be replaced with newly created manufacturing jobs because of different skill requirements. But as a fraction of the overall unemployment rate, construction unemployment is roughly back to where it was prior to the recession.
Barclays Capital: - ... sectors which experienced the largest relative increase in unemployment during the recession (particularly construction) have experienced the largest relative decline in the recovery, suggesting that workers laid off in construction have found jobs elsewhere. Indeed, the ratio of the construction sector unemployment rate to the total is now close to pre-recession levels.
There may be some evidence of a skills mismatch within industries. For example, within the manufacturing sector the Beveridge curves have diverged as well. But have skill requirements in US manufacturing really changed so much during the recession as to generate such a shift?

There is a better explanation that points to a structural shift in employment dynamics. Some refer to it as hysteresis. In engineering the phenomena describes a system that responds not just to its current environment, but to the path it took. A thermostat switch will turn on at a different temperature than it turns off to avoid rapid switching. Built-in hysteresis will assure that the switch "event" depends not just on the current temperature but on whether the temperature got there by increasing or decreasing.
3rd party Ad. Not an offer or recommendation by Investing.com. See disclosure here or remove ads.

It seems that employment dynamics have a built-in hysteresis, driven by the effects of long-term unemployment. Data suggests that the longer someone has been out of work, the longer it takes them to find work.

This means that after a deep prolonged recession, as job vacancies rise, they will be filled at a rate different from when jobs were originally lost.
Barclays Capital: - One reason is so-called hysteresis – a term to explain the long-lasting effect of a temporary shock, in this case, how a cyclical jolt to the economy transmits into persistently higher (ie, structural) unemployment. Long-term unemployment is the most powerful channel for this, in our view. In essence, this is because evidence suggests that the longer a person remains unemployed, the less likely they are to re-enter employment .
Given that the long-term unemployment has been at record levels (chart below), the structural hysteresis effect is far more pronounced than in the past. The path to recovery on the Beveridge curve is very different from the path of decline. The higher "natural" unemployment rate is here to stay.

Which stock should you buy in your very next trade?
With valuations skyrocketing in 2024, many investors are uneasy putting more money into stocks. Unsure where to invest next? Get access to our proven portfolios and discover high-potential opportunities.
In 2024 alone, ProPicks AI identified 2 stocks that surged over 150%, 4 additional stocks that leaped over 30%, and 3 more that climbed over 25%. That's an impressive track record.
With portfolios tailored for Dow stocks, S&P stocks, Tech stocks, and Mid Cap stocks, you can explore various wealth-building strategies.
