The Flat-Topped Red Megaphone Provides a Perfect Set-Up for a Simple H&S Right Shoulder (Green Scenario)
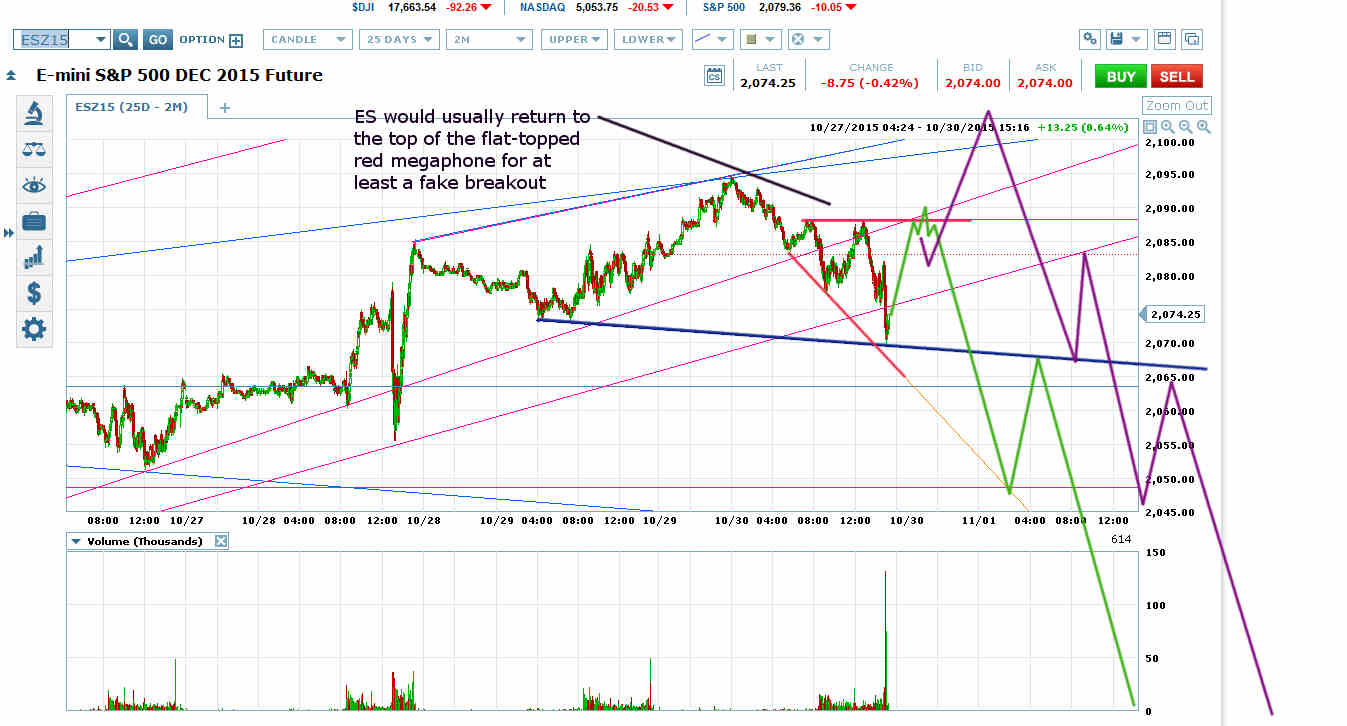
ES ran into heavy late-day selling from the day’s VWAP on the day’s heaviest volume, returning the price to a perfect place for a head and shoulders neckline (navy blue on chart).
That left a particularly nice head and shoulders set-up on the 2-minute chart.
ES spent most of the day forming a flat-topped falling-bottom megaphone (red on chart). ES would usually put in a fast wave up to the formation top for at least a fake breakout. A fake breakout that quickly reentered the formation would target taking out the formation low, which would mean a breakout through the head and shoulders neckline (green scenario).
A genuine breakout through the top of the red flat-topped megaphone would target the navy blue megaphone top for one last new high before a likely breakout downwards from a megaphone top (purple scenario).
A breakout from either formation would target roughly ES 2050, where it would run into the bottom of its orange rising megaphone off the September 29 low as well as the neckline of a larger H&S.

Nested Head and Shoulders Tops on ES 60-Minute Chart
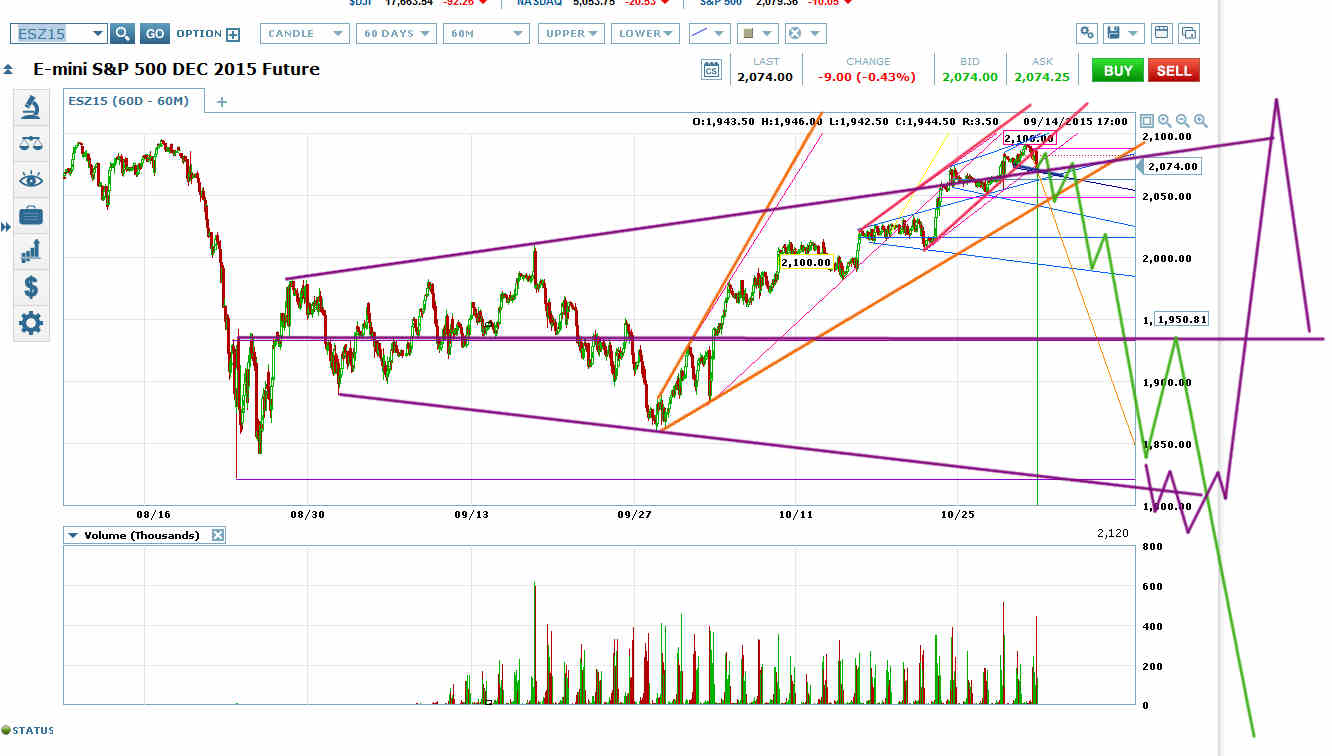
The price would usually bounce off the bottom of the orange rising megaphone but not put in a new high. That would make for the right shoulder of the larger H&S. A breakout through the bottom of the orange rising megaphone would target at least the level of the lowest touch on the formation bottom.
If this trade is going to go wrong, the most likely place for it to go wrong would be immediately after the breakout through the orange rising megaphone bottom. If the price stops moving down and starts swinging back and forth to form a megaphone there, I’ll be posting a set-up to get long again.
The Price Action Near the Purple Megaphone Bottom will Determine if the Next Target is 1500 or a New All-Time High
This is a trading set-up where the price action near the bottom of the purple megaphone is especially important for the longer-term. A small difference in the price action will determine whether the next target is 1500 or a new all-time high.
Essentially, if bulls jump in to buy the retest of the August 24 low before the price takes out the low, the longer-term scenario will be bearish. If the price instead just melts down to the purple megaphone bottom with everyone chasing, the next target will be a new all-time high.
The minimum target for the move down from the purple megaphone top is a breakout through the megaphone bottom roughly equal in size to the breakout ES has put through the top. But if ES can retrace to the purple megaphone VWAP at 1950 from a place in between the August 24 low and the September 29 low, it will be legal for a breakout downwards from the purple megaphone with a target as low as the 1500 area (green scenario).
However, if ES just melts down to the purple megaphone bottom, taking out the August 24 low before a retrace to 1950, the target from the purple megaphone bottom will be a new all-time high at the purple megaphone top (purple scenario).
Which stock should you buy in your very next trade?
With valuations skyrocketing in 2024, many investors are uneasy putting more money into stocks. Unsure where to invest next? Get access to our proven portfolios and discover high-potential opportunities.
In 2024 alone, ProPicks AI identified 2 stocks that surged over 150%, 4 additional stocks that leaped over 30%, and 3 more that climbed over 25%. That's an impressive track record.
With portfolios tailored for Dow stocks, S&P stocks, Tech stocks, and Mid Cap stocks, you can explore various wealth-building strategies.
