Euro advanced due to tensions within the ECB The euro strengthened on Tuesday following a report citing internal tensions within the European Central Bank. The Eurozone’s national central bankers plan to challenge the ECB President Mario Draghi at Thursday’s meeting, over his move to set a target for increasing the Bank’s balance sheet size, after the Governing Council agreed not to make any figure public. This left the market expecting limits on future ECB monetary policy and a balance sheet size target to be achieved. The euro advance could be attributed to the fact that the markets where pricing a large scale QE program, but after the reported tensions and disagreements within the ECB these expectations have been reduced.
What’s more, the reported tensions came after the European Commission slashed its Eurozone economic growth forecast. However, this had limited impact on the single currency as the market had already partly priced in the slower growth.
Elsewhere, the Bank of Japan Governor Haruhiko Kuroda who last week surprised the markets by expanding the Bank’s massive monetary stimulus program, said that the Bank is ready to do more to hit its inflation target. The Japanese yen weakened further following Governor’s comments on expectations that further measures could be taken if the Bank fails to reach its target.
In New Zealand unemployment rate fell to 5.4% in Q3, from 5.5% in Q2, the lowest level last seen in Q1 2009. At the same time, the participation rate rose to 69% in Q3 from 68.9% in Q2 and average hourly earnings accelerated to 1.4% qoq from 0.5% qoq. Given that the inflation rate remained unchanged at 0.3% qoq in Q3, this suggests that the real average earnings accelerated in Q3. This could add upward pressure on consumer prices in the coming months. NZD/USD surged following the strong employment data and broke our resistance level of 0.7800 and remained elevated during the Asian session. I believe that even though labor market seems to gain momentum, the Reserve Bank of New Zealand will need more evidence on the country’s economic condition to alter its on-hold stance.
As for today’s indicators, we get the final service-sector PMIs for October from the countries we got the manufacturing data for on Monday. As usual, the final forecasts from France, Germany and Eurozone are the same as the initial estimates, while the UK service-sector PMI is expected to have decreased slightly. The revisions in the final manufacturing PMIs on Monday, increase the possibilities that we could see revisions in the service-sector PMIs as well. Eurozone’s retail sales for September are also coming out and they are expected to have declined on a monthly basis, adding to the recent weak data coming from the bloc.
In the US, the most important indicator we get is the ADP employment report for October two days ahead of the NFP release. The ADP report is expected to show that the private sector gained slightly more jobs in October than it did last month. That would probably be USD-supportive. The final Markit service sector PMI and the ISM non-manufacturing index both for October are also to be released.
We have three Fed speakers on Wednesday’s agenda. Minneapolis Fed President Narayana Kocherlakota, Richmond Fed President Jeffrey Lacker and Boston Fed President Eric Rosengren also speak.
The Market
EUR/USD continues higher
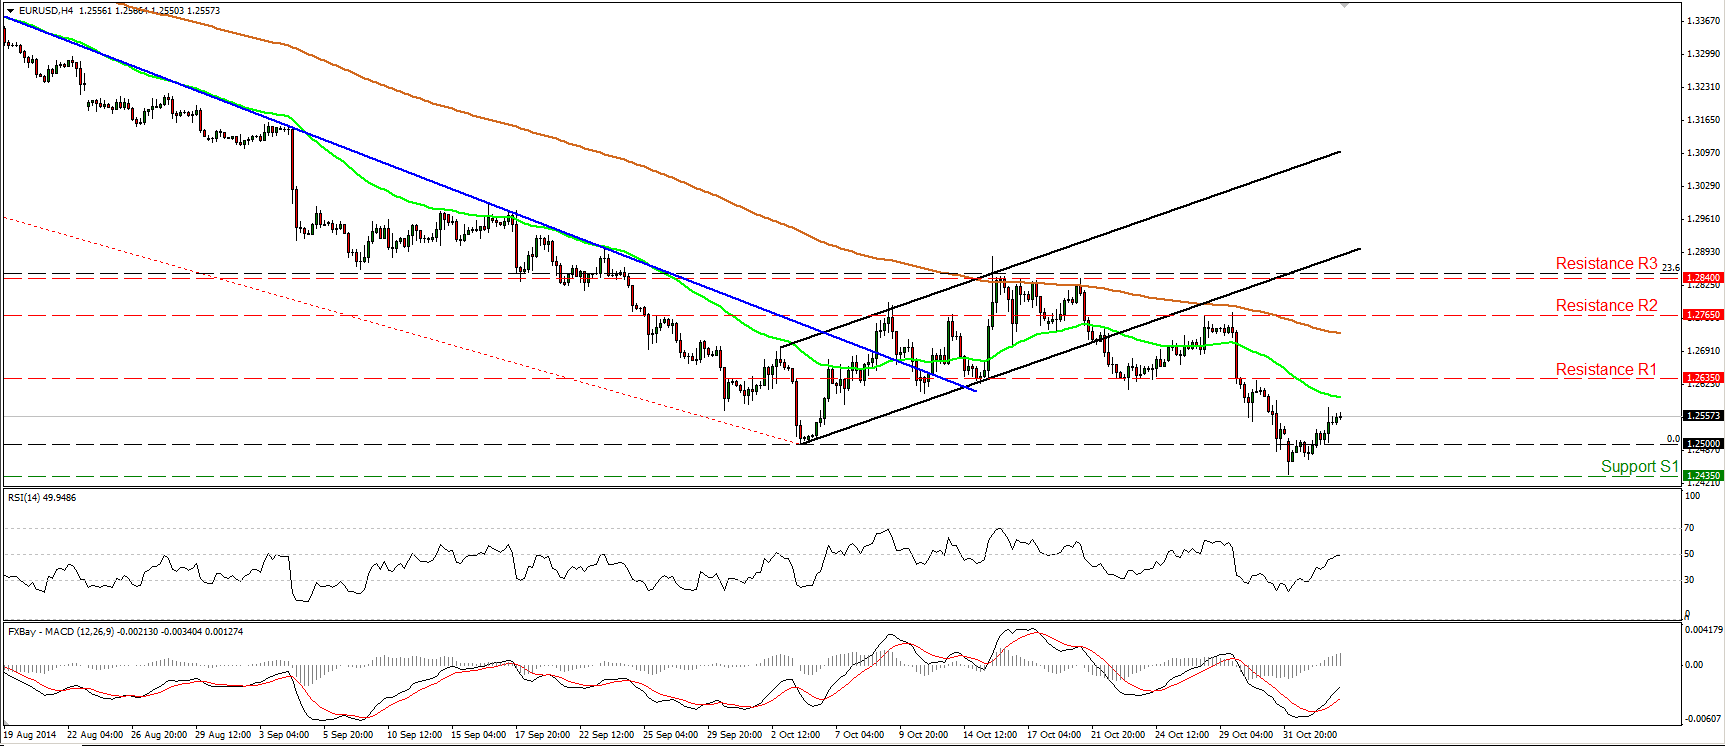
EUR/USD continued higher on Tuesday, confirming my concerns that the recovery from 1.2435 (S1) may continue. Checking our momentum studies, I cannot rule out further upside at the moment. The RSI just crossed above its 50 line, while the MACD lies above its trigger line and is pointing up. However, since the possibility for a lower high still exists, I still see the recent up leg as a corrective move. On the daily chart, the price structure remains lower peaks and lower troughs below both the 50- and the 200-day moving averages, and this keeps the overall downtrend intact. But, taking into account that I see positive divergence between our daily oscillators and the price action, I would prefer to sit on the sidelines for now and wait for momentum and price action to confirm each other.
• Support: 1.2435 (S1), 1.2400 (S2), 1.2300 (S3).
• Resistance: 1.2635 (R1), 1.2765 (R2), 1.2840 (R3).
EUR/JPY maintains the strong bullish momentum
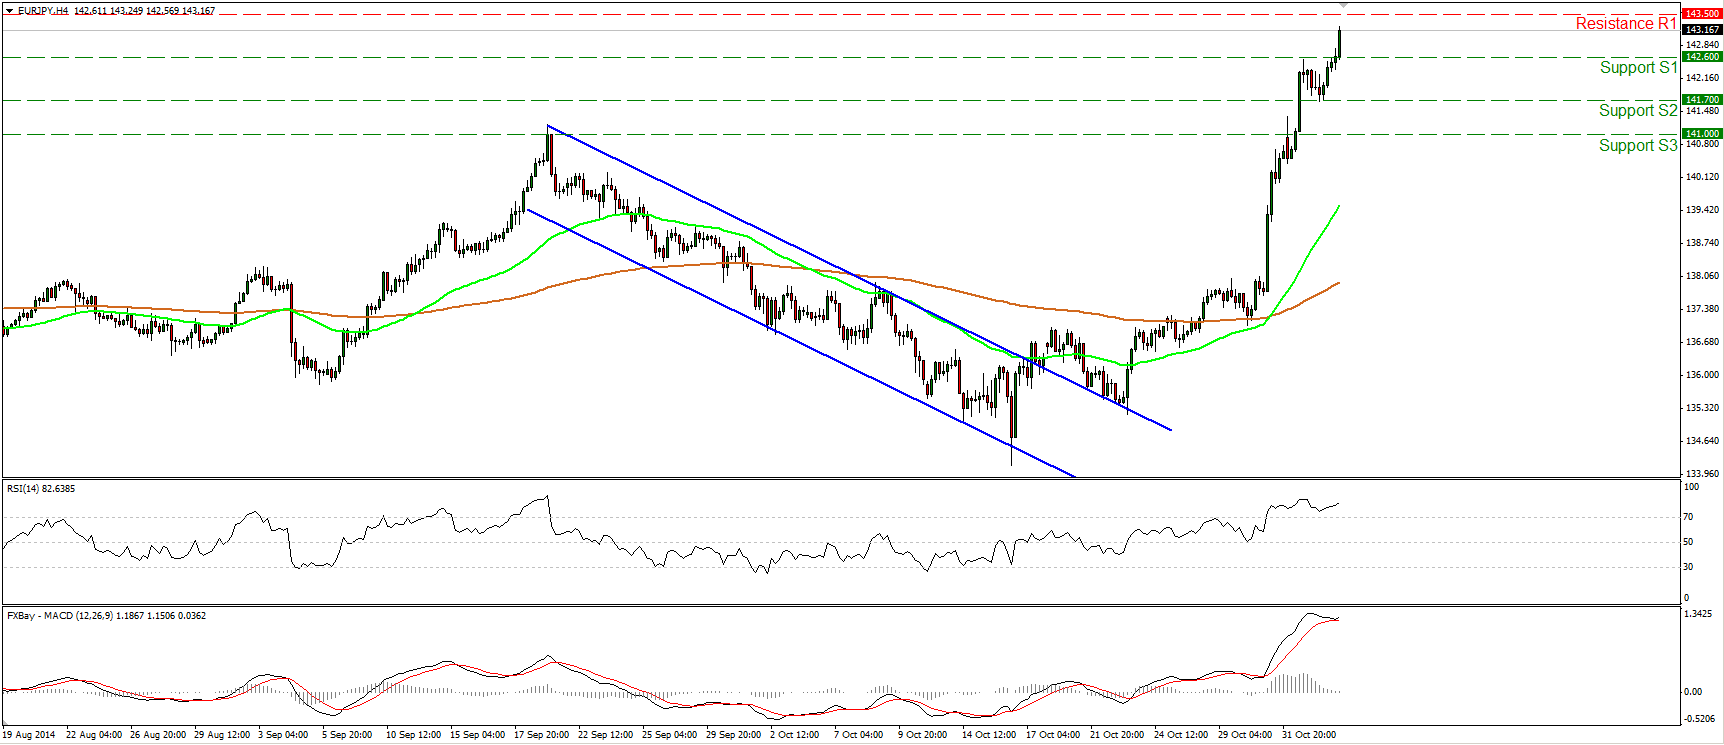
EUR/JPY firmed up yesterday, violating the resistance (turned into support) line of 142.60 (S1). Today, during the early European morning, the rate is heading towards the highs of April, at 143.50 (R1), where a decisive upside break is likely to see scope for extensions towards the support-turned-into-resistance hurdle of 144.35 (R2), defined by the low of the 31st of December 2013. In the bigger picture, the break above the highs of the 19th of September confirmed a forthcoming higher high on the daily chart and this keeps the overall outlook of EUR/JPY to the upside. Shifting my attention at our daily momentum studies, I see that the 14-day RSI entered its overbought zone and is pointing up, while the daily MACD remains above both its zero and signal lines. These signs confirm the strong bullish sentiment towards the pair and support my view that we may see the rate higher in the close future.
• Support: 142.60 (S1), 141.70 (S2), 141.00 (S3).
• Resistance: 143.50 (R1), 144.35 (R2), 145.00 (R3).
GBP/USD stays near 1.6000
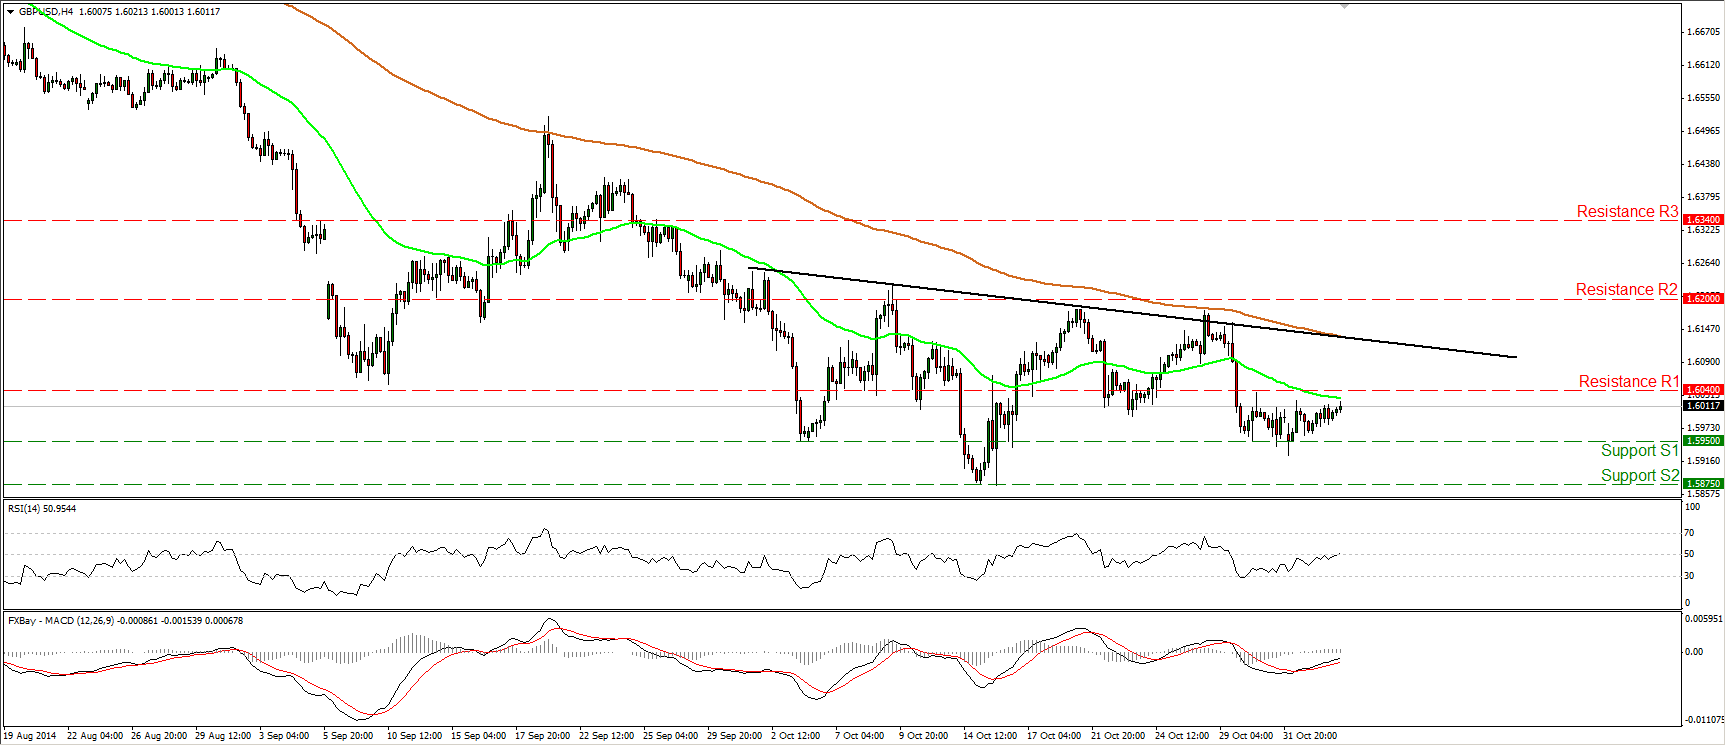
GBP/USD moved somewhat higher, staying near 1.6000. The pair appears to be oscillating between the support line of 1.5950 (S1) and the resistance of 1.6040 (R1), thus I would prefer to keep my neutral stance as far as the short-term picture is concerned. . As for the broader trend, I will maintain the view that as long as Cable is trading below the 80-day exponential moving average, the overall path remains negative. But taking into account that I still see positive divergence between both the daily momentum indicators and the price action, I would stay mindful of an upside corrective phase before the next leg down. I would prefer to see a dip below 1.5875 before getting again confident on the downside. Such a dip is likely to confirm a forthcoming lower low and perhaps trigger extensions towards the resistance-turned-into support barrier of 1.5720 (S3), defined by the high of the 21st of August 2013.
• Support: 1.5950 (S1), 1.5875 (S2), 1.5720 (S3).
• Resistance: 1.6040 (R1), 1.6200 (R2), 1.6340 (R3).
Gold stays above 1160
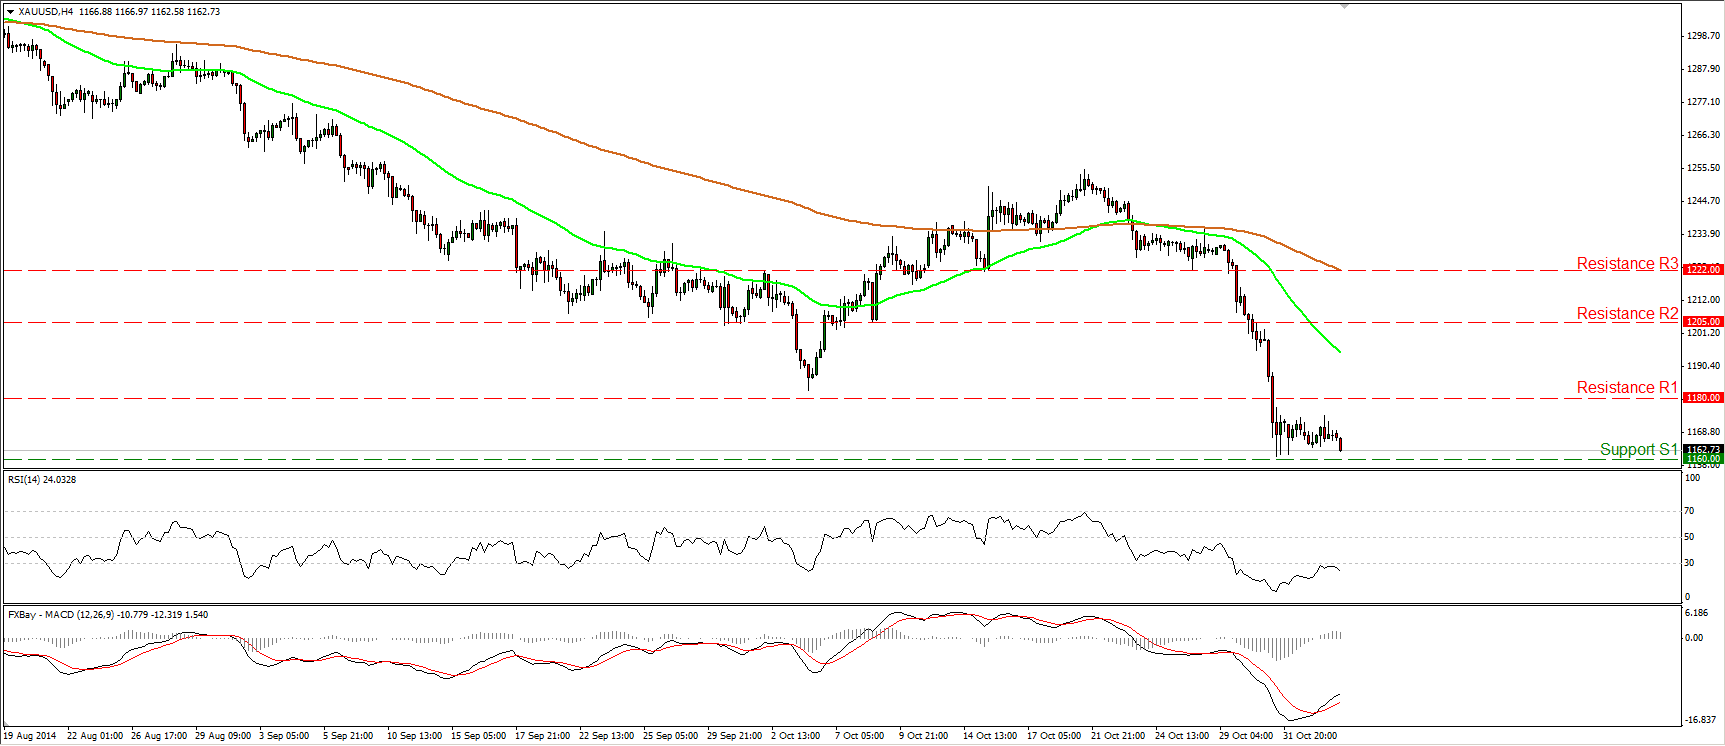
Gold continued ranging, staying between the 1160 (S1) hurdle, which coincides with the 61.8% retracement level of the October 2008 - September 2011 major advance, and the key support-turned-into-resistance barrier of 1180 (R1). Today, during the early European morning, the metal moved lower somewhat and could challenge again the 1160 (S1) area any time soon. If the bears are strong enough to overcome that obstacle, I would expect them to target the low of the 19th of April 2010, at 1125 (S2). Although the MACD remains above its trigger line and is pointing up, the RSI found resistance near its 30 line, turned down and seems willing to stay a bit longer within its extreme zone. This adds to my view that we may see the yellow metal lower in the near future.
• Support: 1160 (S1), 1125 (S2), 1100 (S3).
• Resistance: 1180 (R1), 1205 (R2), 1222 (R3).
WTI dips below 78.00
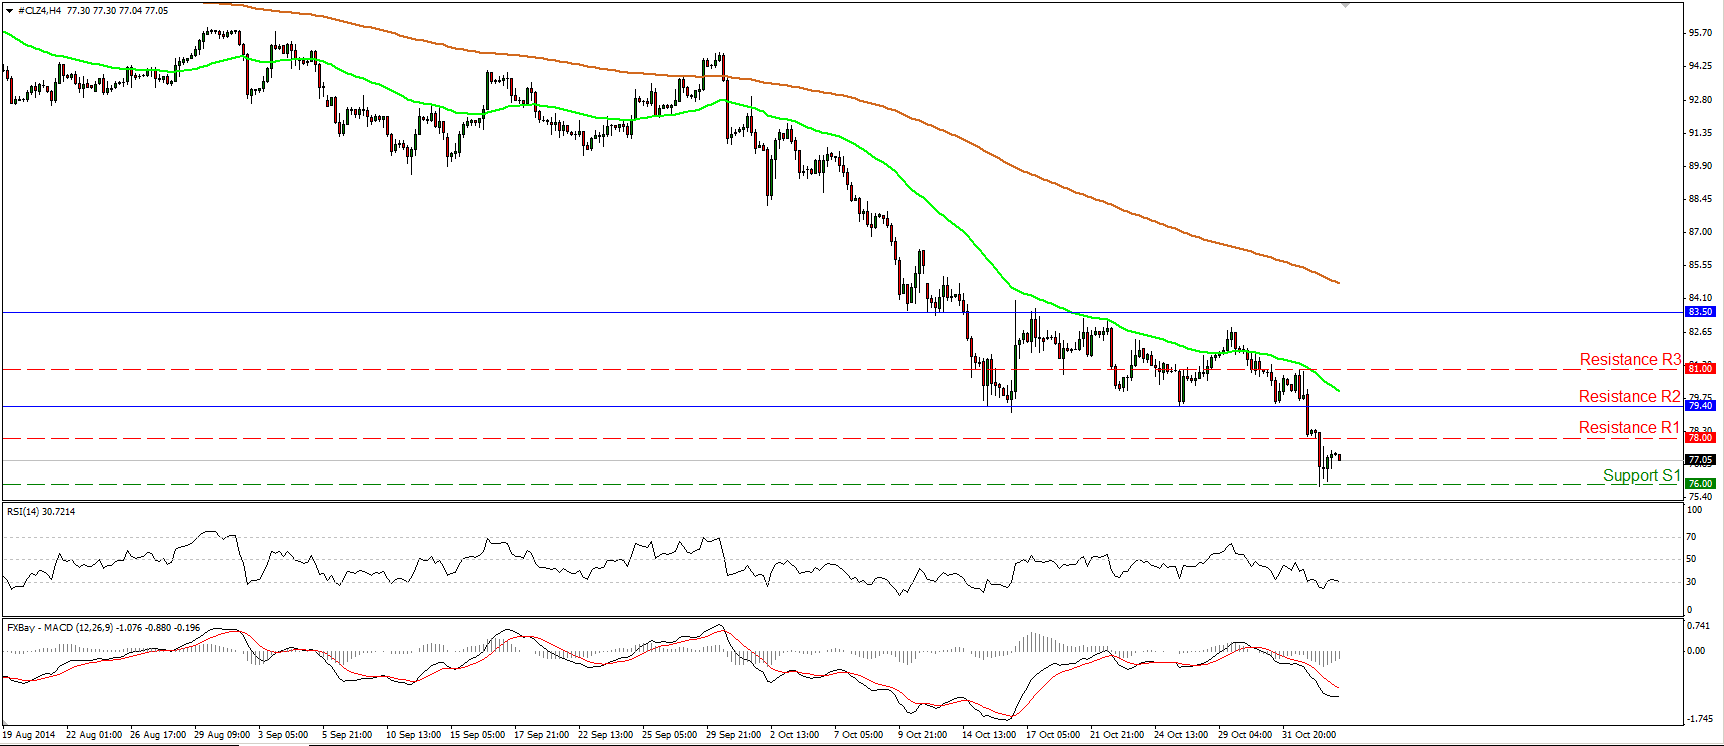
WTI continued tumbling on Tuesday, falling below the support (turned into resistance) hurdle of 78.00. However, WTI found support near 76.00 before rebounding somewhat. As long as the 79.40 (R2) line holds as a resistance, I would maintain the view that the price is likely to challenge the psychological zone of 75.00 (S2), defined by the lows of October 2010. On the daily chart, the price structure remains lower lows and lower highs below both the 50- and the 200- day moving averages, keeping the overall path to the downside. Moreover, the 14-day RSI dipped again within its oversold field, while the daily MACD, already negative, has turned down and fell below its signal line. This designates accelerating downside momentum and amplifies the case for further declines in the close future.
• Support: 76.00 (S1), 75.00 (S2), 71.00 (S3).
• Resistance: 78.00 (R1), 79.40 (R2), 81.00 (R3).
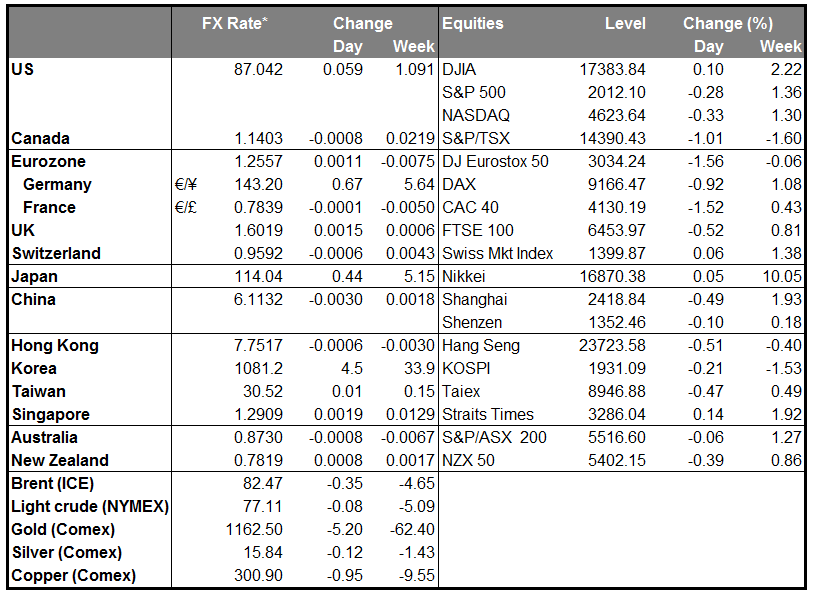
BENCHMARK CURRENCY RATES - DAILY GAINERS AND LOSERS
MARKETS SUMMARY
Which stock should you buy in your very next trade?
With valuations skyrocketing in 2024, many investors are uneasy putting more money into stocks. Unsure where to invest next? Get access to our proven portfolios and discover high-potential opportunities.
In 2024 alone, ProPicks AI identified 2 stocks that surged over 150%, 4 additional stocks that leaped over 30%, and 3 more that climbed over 25%. That's an impressive track record.
With portfolios tailored for Dow stocks, S&P stocks, Tech stocks, and Mid Cap stocks, you can explore various wealth-building strategies.

