As the trumpets sound to signal the start of earnings season, the battle between fundamentals and “hope” begins. While earnings expectations have weakened markedly in recent months, the bulls remain steadfast in their belief the market correction is now over.
As I discussed in this past weekend’s missive :
“‘The stock market just got off to its best start in 13 years. The 7-session start to the year is the best for the Dow, S&P 500 and Nasdaq since 2006.’ – Mark DeCambre via MarketWatch
While headlines like this will certainly get ‘‘clicks’ and ‘likes,’ it is important to keep things is perspective. Despite the rally over the last several sessions, the markets are still roughly 3% lower than where we started 2018, much less the 11% from previous all-time highs.
Importantly, there has been a tremendous amount of ‘technical damage’ done to the market in recent months which will take some time to repair. Important trend lines have been broken, major sell-signals are in place, and major moving averages have crossed each other signaling downward pressure for stocks.
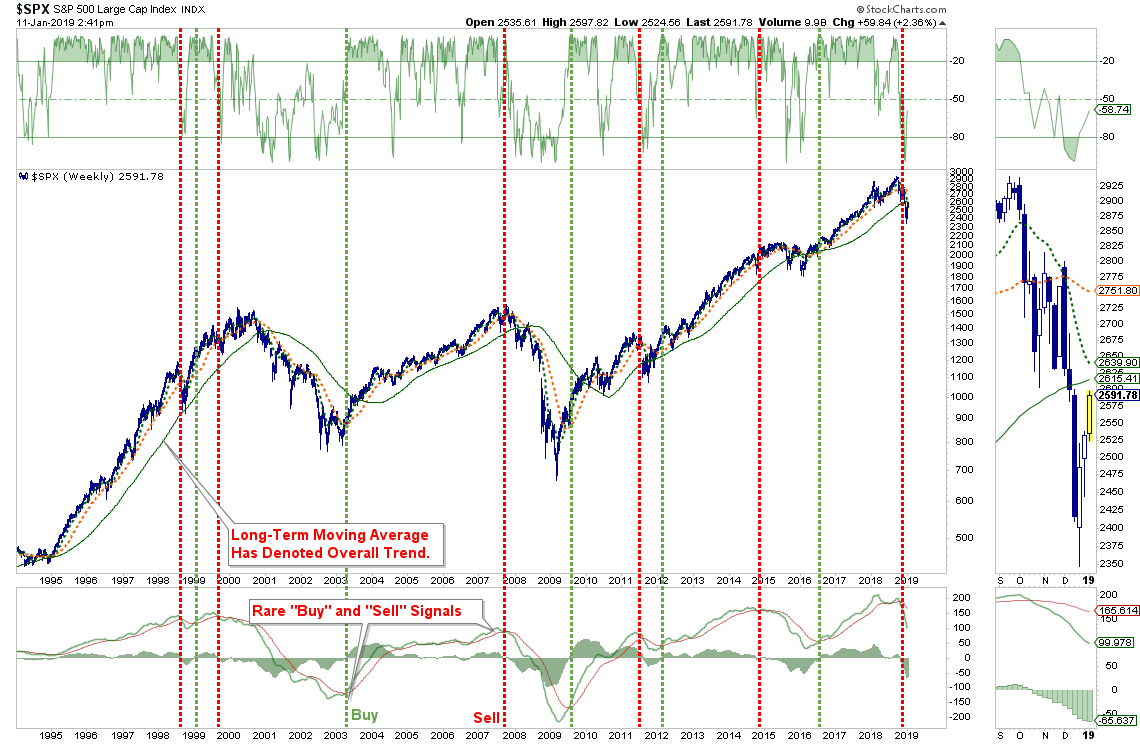
“While the chart is a bit noisy, just note the vertical red lines. There have only been a total of 6-periods in the last 25-years where all the criteria for a deeper correction have been met. While the 2011 and 2015 markets did NOT fall into more protracted corrections due to massive interventions by Central Banks, the current decline has no such support currently.
So, while there are many headlines circulating the ‘interweb’ currently suggesting the ‘Great Bear Market Of 2018’ is officially over, I would caution you against getting overly bullish too quickly.”
However, from a portfolio management perspective it is always a valuable exercise to analyze both sides of the argument to make a better investment decision. Therefore, let’s take a look at the technical case for the markets from both a bullish and bearish perspective.
THE BULL CASE
1) Big Rallies Happen Off Big Lows
It isn’t surprising given the magnitude of the rally following the Christmas Eve low, the “bullish bias” would quickly return. There is precedent for such exuberance as well as recently noted by Bespoke.
As they showed in their table below, whenever there has previously been a sharp fall of more than 15% in a quarter, followed by a sharp rally of at least 10% in the following days, the markets were higher in the near future.
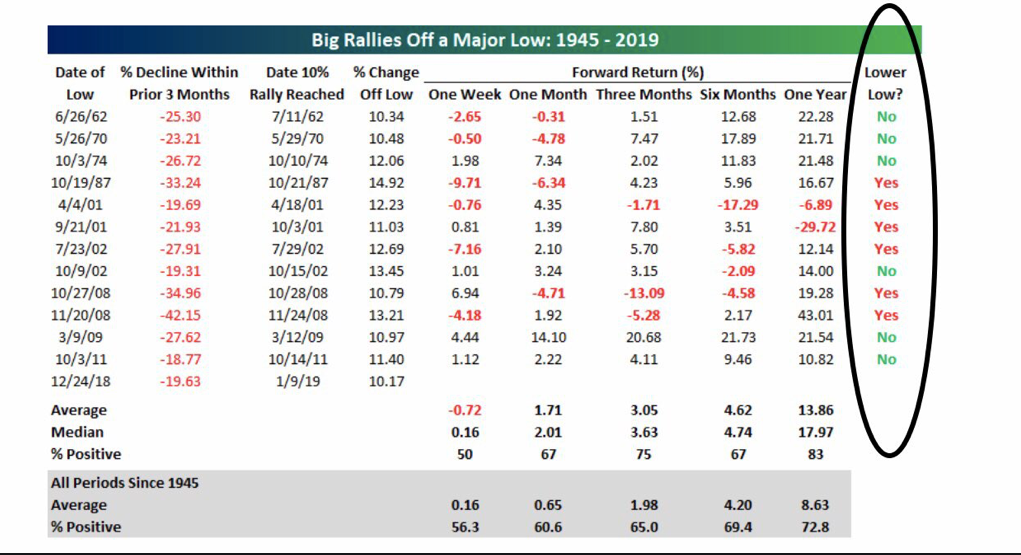
Such a combination of events has only occurred 12 times over the past 75 years, and the market was higher 75% of the time in 3-months and higher 83% of the time in 12-months.
But note that in some of these cases these were big rallies within the context of a bear market such as the rallies in 2001 and 2008.
2) The Fed Has Gone “Dovish”
In recent weeks, the previously “hawkish” Federal Reserve has become much more “dovish” suggesting a “pause” in monetary policy is possible if needed.
This change has not gone unnoticed by the bulls. Since Fed Chair Jerome Powell used the word “patient” when referring to the Fed’s approach to hiking interest rates, stocks went straight up. Given there had seemingly been a disconnect between the Fed, the markets, and the White House, the change was welcome support for the bulls.
It is also believed that the Fed will back off of their balance sheet reductions if needed, although Jerome Powell has not made any public indication such as an option currently.
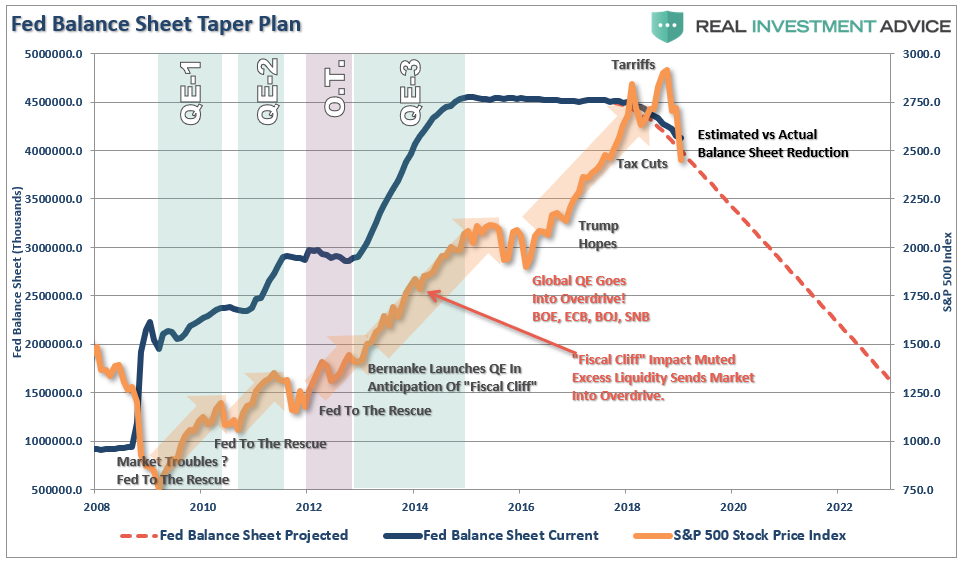
While not really a “technical measurement,” such a change in monetary policy would certainly provide support for the bulls in the near term.
3) Advance-Decline Line Is Improving
The participation by stocks in the recent bullish advance has been strong enough to push the advance-decline line above the recent downtrend.
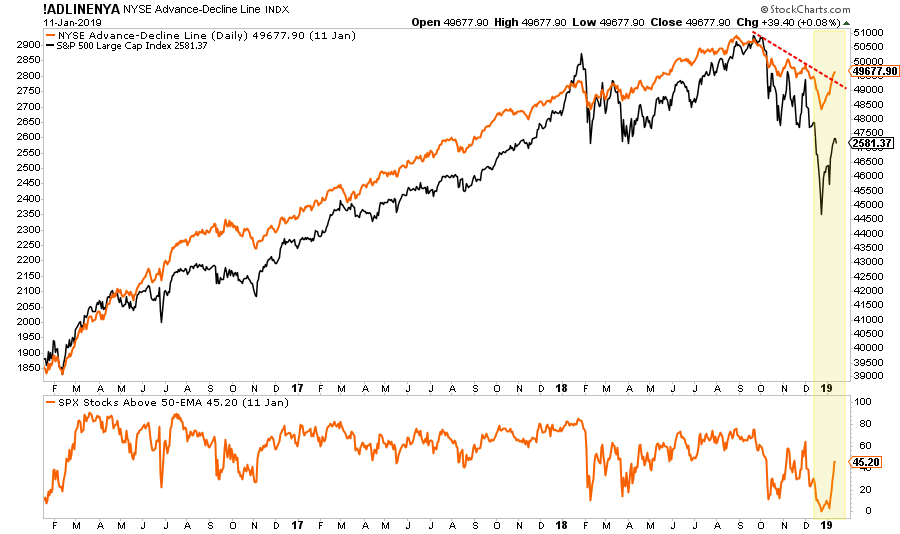
Such a rise in participation suggests the momentum behind stocks is supportive enough to push stocks to higher levels and should not be dismissed lightly.
Currently, as shown above, the short-term dynamics of the market have improved sufficiently enough to trigger an early “buy” signal. This suggests a moderate increase in equity exposure is warranted given a proper opportunity. However, to ensure that the current advance is not a “head-fake,” as repeated seen previously, the market will need to reduce the current overbought condition without violating near-term support levels OR reversing the current buy signal.
There is a good bit of work to do to satisfy those conditions, but things are indeed improving.
Let me be VERY CLEAR – this is VERY SHORT-TERM analysis. From a TRADING perspective, there is a tradeable opportunity. This DOES NOT mean the markets are about to begin the next great secular bull market. Caution is highly advised if you are the type of person who doesn’t pay close attention to your portfolio OR have an investment strategy based on “hoping things will get back to even” rather than selling.
THE BEAR CASE
The bear case is more grounded in longer-term price dynamics – weekly and monthly versus daily which suggests the current rally remains a reflexive rally within the confines of a more bearish backdrop.
1) Short-Term: Market Rally On Declining Volume
The recent market rally, while strong, occurred amidst declining volume suggesting more of a short-covering rally rather than a conviction to a “bull market” meme.
Furthermore, the rally which was one of the strongest seen in the last decade barely retraced 38.2% of the previous decline. In order for the market to reverse the current “bearish” context, it will require a substantial move higher back above the 200-day moving average.
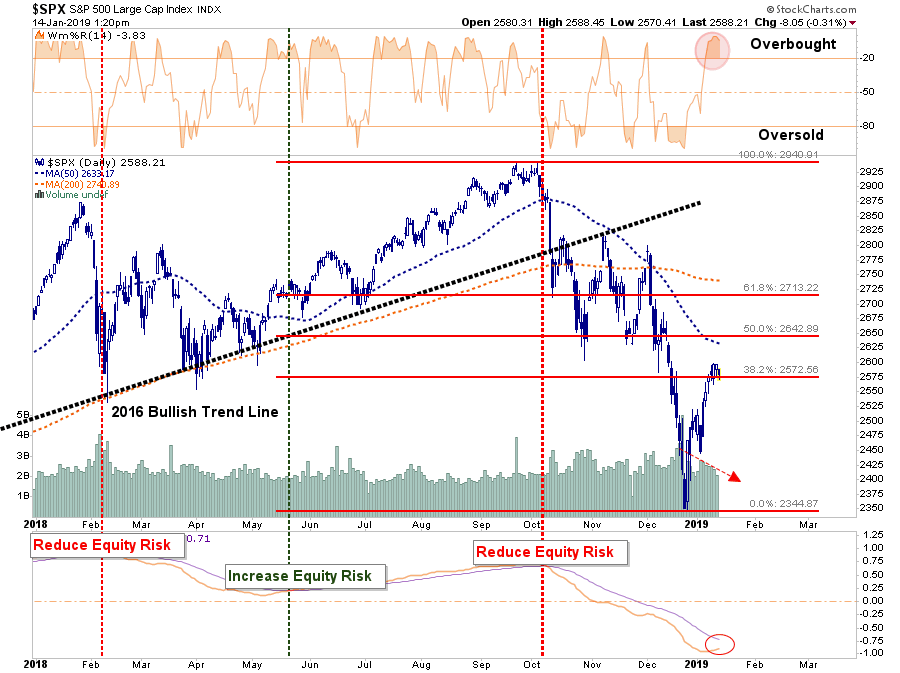
Given the economic and fundamental backdrop currently at play, such a rally will likely prove to be very challenging.
2) Longer-Term Dynamics Still Bearish
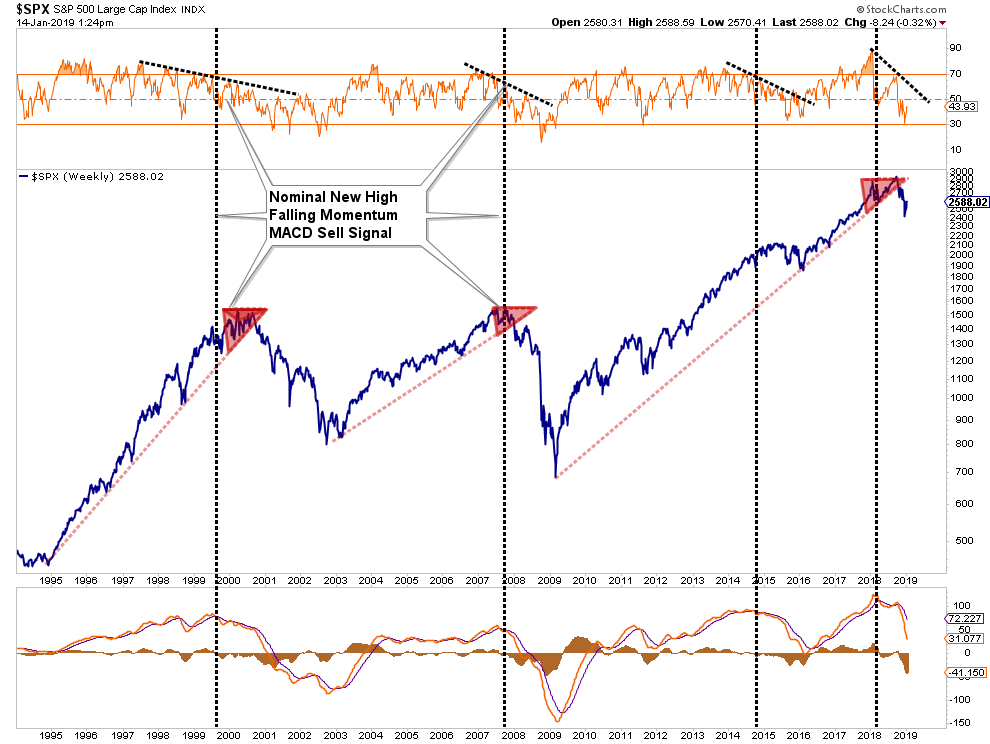
If we step back and look at the market from a longer-term perspective, where true price trends are revealed, we see a very different picture emerge. As shown below, the current dynamics of the market are extremely similar to those of the previous two bull market peaks. Given the deterioration in revenues, bottom-line earnings, and weaker economics, the backdrop between today and the end of previous bull markets is consistent.
In both previous cases, the market peaked in a consolidation process, broke down through longer-term major trend lines, and did so on falling momentum combined with a long-term moving average convergence-divergence (MACD) “sell” signal.
3) Bonds Ain’t “Buyin’ It”
If a “bull market” were truly taking place we should see a flight from “safety” back into “risk.” As shown below, the declines in the stock-bond-ratio have been coincident with both short and long-term market corrections.
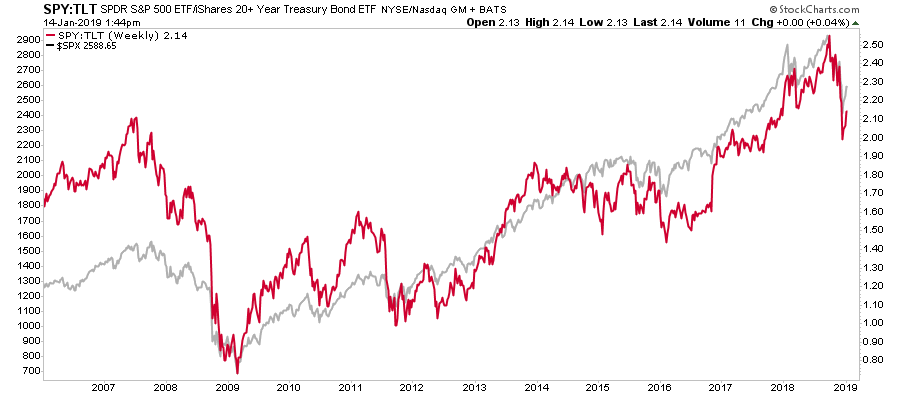
Currently, we are not seeing “risk-taking” being a predominant factor at the moment. Could this change, absolutely. However, currently, despite the surge in the markets from the December lows, both Treasury yields and the stock/bond ratio have remained fairly firm.
Such continues to suggest the current market rally remains a “counter-trend rally” within the context of an ongoing correction.
What you decide to do with this information is entirely up to you. As I stated, I do think there is enough of a bullish case being built to warrant taking some equity risk on a very short-term basis.
However, the longer-term dynamics are clearly bearish. When those negative price dynamics are combined with the fundamental and economic backdrop, the “risk” of having excessive exposure to the markets greatly outweighs the potential “reward. “
Could the markets rocket higher as some analysts currently expect? It is quite possible particularly if the Federal Reserve reverses course and becomes much more accommodative.
For now, the upside remains limited to roughly 80 points as compared to 230 points of downside.
Those are odds that Las Vegas would just love to give you.
Which stock should you buy in your very next trade?
AI computing powers are changing the stock market. Investing.com's ProPicks AI includes 6 winning stock portfolios chosen by our advanced AI. In 2024 alone, ProPicks AI identified 2 stocks that surged over 150%, 4 additional stocks that leaped over 30%, and 3 more that climbed over 25%. Which stock will be the next to soar?
Unlock ProPicks AI
