Yesterday passed under the sign of further strengthening of the US dollar, which contradicts our view, implying the need for corrective movement in the markets. The reason for such dynamics of quotations was the statistics, which were published during the day. The indexes of business activity in the services sector of Germany and the Eurozone were, in general, worse than predictions, which led to a weakening of the European currency. The EUR/USD quotes broke the 1.1500 mark in the night from Wednesday to Thursday and updated the local minimum values in the area of 1.1465. A similar pattern was observed in another pair of GBP/USD, whose quotes fell to the area of 1.2925-1.2930. In the second half of yesterday, it was published by ADP the change in the number of non-farm workers in the US. The indicator turned out to be significantly higher than predictions and amounted to 230 thousand people, which led to another growth impulse of the American currency. Thus, the fundamental factors outweighed the value of technical signals yesterday, which indicate the need for corrective movement. It should be noted that the formation of new local minima for the above pairs was accompanied by the appearance of a new portion of corrective signals. A similar pattern is observed for the USD/JPY and USD/CHF pairs, where the update of the local maximum prices did not result in the update of the maxima of a number of technical analysis indicators.
Today, the economic calendar is not rich in significant statistics. This factor implies a fairly quiet course of trading. However, the above circumstances allow us to retain the previous view that the markets accumulate a set of signals indicating a high probability of a local weakening of the US currency.
EUR/USD
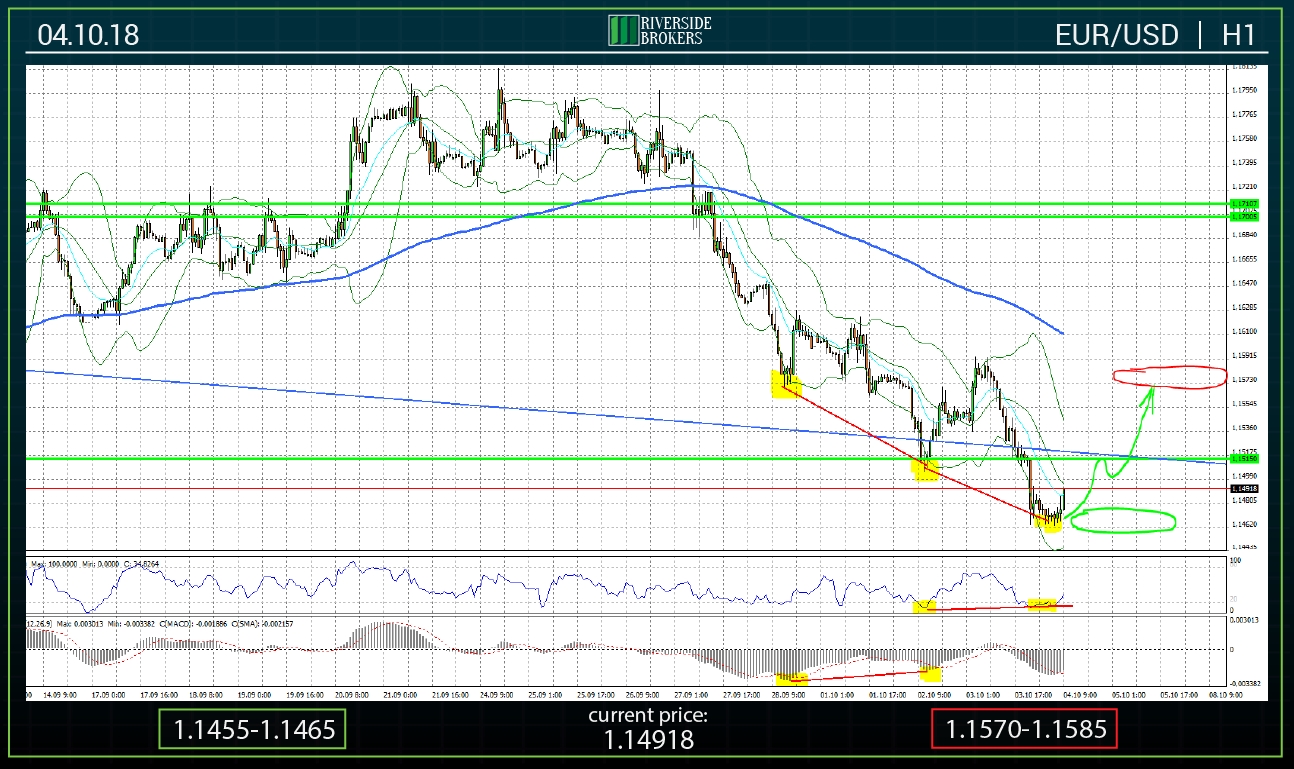
Tonight, the EUR/USD pair broke through the support around 1.1500 and fell to the area of 1.1465-1.1470. The negative dynamics of prices was facilitated by the statistics on business activity indices in the services sector in Germany and the Eurozone, which yesterday turned out to be worse than the participants' expectations. Moreover, similar statistics on the United States in the second half of trading, on the contrary, exceeded predictions, which led to further strengthening of the dollar. However, updating the local minimum values is accompanied by the formation of another portion of the technical analysis signals, indicating the probability of corrective movement. This time there is a convergence between the Tuesday and Wednesday lows and the corresponding values of the RSI oscillator. Thereunder and with the background of today's half-empty economic calendar, it is expected a weakening of the US currency. The purpose of the corrective movement is the area 1.1570-1.1590.
The support zone is the area 1.1455-1.1465.
Resistance remained in the range of 1.1570-1.1585.
GBP/USD
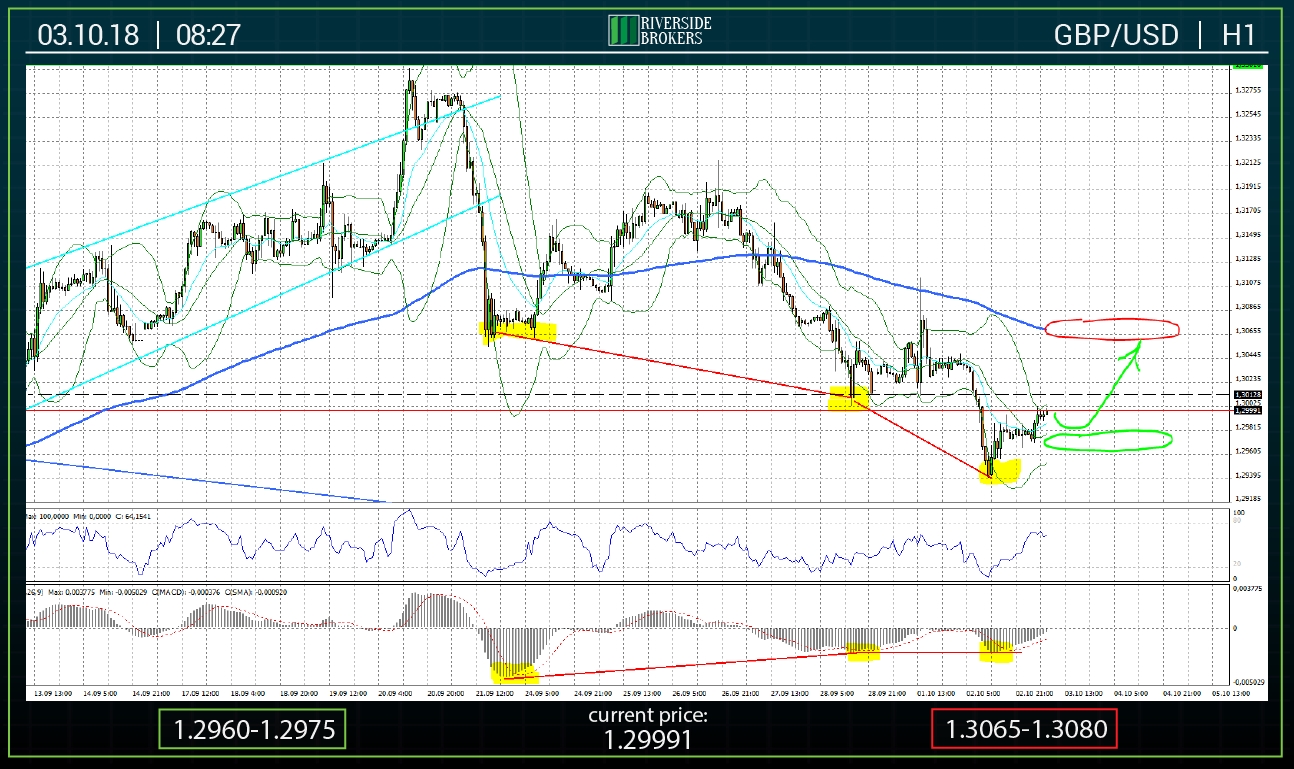
The fundamental picture of yesterday played on the side of the dollar, which did not allow the scenario of weakening of the us currency to be realized. GBP/USD quotes came close to the support around 1.2900. It should be noted that the negative dynamics of quotations, similarly to the previous pair, was accompanied by the continuation of the formation of a new portion of technical signals indicating the possibility of ending the decline in prices and the start of growth. Following yesterday's trading, there is another convergence between the local minima of the quotes and the corresponding values of the MACD indicator. The goal of the projected increase is the 200-period MA on the H1 time frame, located in the 1.3050 area.
The support zone is in the area of 1.2900-1.2925 (green oval).
The resistance zone is in the range 1.3045-1.3055 (red oval).
USD/JPY
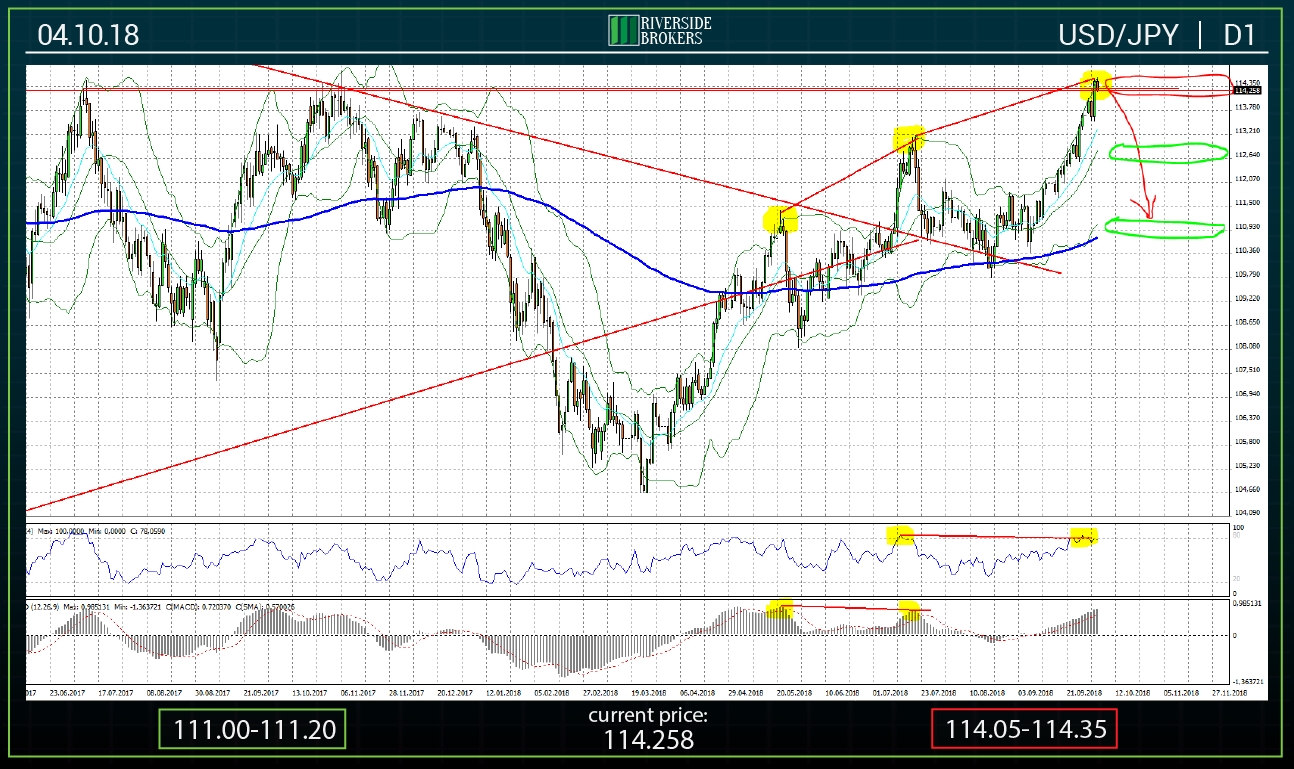
As a result of the continued strengthening of the US dollar, the USD/JPY quotes updated their maximum prices since November 2017 and reached the upper limit of the resistance zone. It is worth noting that prices have repeatedly rebounded down from district 114.00-114.50 during 2017, which indicates the strength of this zone. At the same time, the technical picture continues to form corrective signals. On the chart, the marker of yellow color indicates the areas of local maxima and the corresponding values of the indicators indicating divergence. Based on this, in the next trading sessions, prices are projected to decline with a target of 111.00.
Support and resistance zones are located in the ranges 111.00-111.20, 112.55-112.65 (green ovals) and 114.05-114.35 (red oval), respectively.
USD/CHF
The pair USD/CHF has broken through resistance in the area of 0.9860-0.9875 and has reached the area above the mark of 0.9900. The growth of quotations was the result of the recent strengthening of the US dollar in world markets. However, the positive dynamics of prices is accompanied by the accumulation of technical analysis signals indicating the probability of a corrective movement. At the end of yesterday's trading, another divergence was recorded between the local maximums of prices and the values of the MACD indicator. The beginning of the decline in quotations is predicted in order to reach the range of 200-period MA on H1 and H4 time frames passing through the area of 0.9755-0.9780.
Support zones are located in areas of 0.9830-0.9850 and 0.9755-0.9775 (green ovals).
Resistance is located in the range 0.9900-0.9920 (red oval).
Which stock should you buy in your very next trade?
With valuations skyrocketing in 2024, many investors are uneasy putting more money into stocks. Unsure where to invest next? Get access to our proven portfolios and discover high-potential opportunities.
In 2024 alone, ProPicks AI identified 2 stocks that surged over 150%, 4 additional stocks that leaped over 30%, and 3 more that climbed over 25%. That's an impressive track record.
With portfolios tailored for Dow stocks, S&P stocks, Tech stocks, and Mid Cap stocks, you can explore various wealth-building strategies.


