Asia stocks mixed; Australia gains on soft CPI, Japan steady before BOJ
T2108 Status: 72.9%
VIX Status: 14.5
General (Short-term) Trading Call: Short (fade rallies)
Active T2108 periods: Day #176 over 20%, Day #22 over 60%, Day #1 over 70% (overperiod)
Commentary
Since 1986, I have recorded 184 overbought periods through March 4, 2014. Over this period, I count approximately 11 periods where T2108 hit overbought at least 3 times in the span of 13 trading days. Today, marks the 12th occasion.
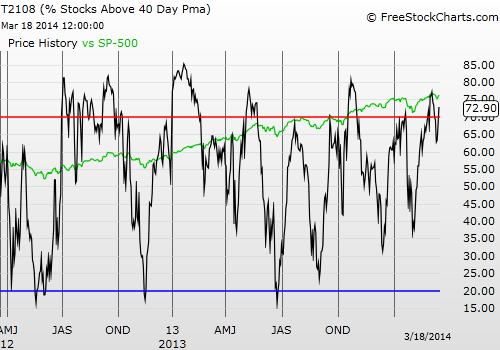
When the S&P 500 (SPY) staged a sharp one-day recovery that just missed holding T2108 in overbought status, I (marginally) switched my trading call to short and warned of more churn ahead. At the time, I was NOT imaging T2108 bouncing in and out of overbought status. Yet, that is what has happened as T2108 made a strong move today, returning to overbought status with a close at 72.9%. The S&P 500 made almost as strong a move as it did yesterday with a gain of 0.7%. The trading call stays at short until the S&P 500 makes a fresh all-time high. Such a move would beat out the presumed top marked by the “evening star” chart pattern that typically mark that end of upward momentum. Such a move would also put a quick end to my call of a top.
While the churn in and out of overbought territory is frustrating, I know I need to stick to the rules so that I am in position whenever the big move (up or down) comes. In the meantime, I will continue looking at individual charts that are consistent with the current trading call or can act as a hedge for it. To that end, I closed out my call options on Google (GOOG) as the stock has experienced nice follow-through (as expected) from a retest of its 50DMA. GOOG’s uptrend is too strong to be taken out so easily. But I think it is coming sooner than later…
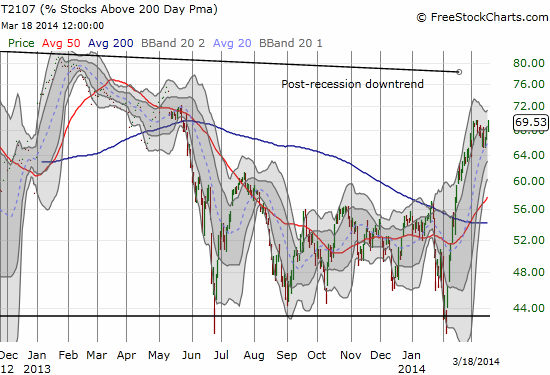
The potential quick end to my call for a top reminded me to take a look at the percentage of stocks trading above their respective 200DMAs, or T2107. It turns out that T2107 has yet to retest its post-recession downtrend. In essence, there remains room to expand although I have no reason to insist that T2107 MUST retest the downtrend line from here.

T2107 has experienced a sharp rebound from year-long support
The chart above makes me think that T2107 is quite extended given the sharpness of the upward push. It is the exact reverse of the over-extended move that took it down in June of last year.
The Federal Reserve is up next (on Wednesday, March 19th). I am bracing for a game-changing move from the market in response after the dust settles from typical pre/post-Fed gyrations. In preparation, I added a few more shares in ProShares Ultra VIX Short-Term Fut ETF (UVXY) that I hope to sell at a profit on the next pop in volatility.
Daily T2108 vs the S&P 500

Black line: T2108 (measured on the right); Green line: S&P 500 (for comparative purposes)
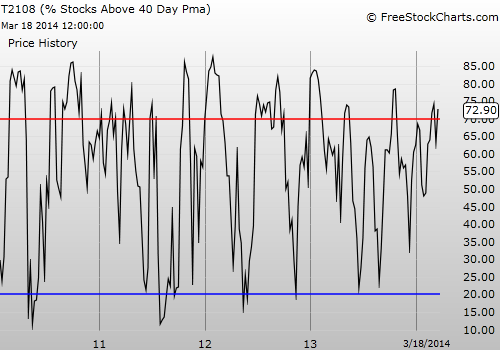
Red line: T2108 Overbought (70%); Blue line: T2108 Oversold (20%)
Weekly T2108

Be careful out there!
Full disclosure: Long SSO puts and calls, long UVXY shares; short GOOG
Which stock should you buy in your very next trade?
AI computing powers are changing the stock market. Investing.com's ProPicks AI includes 6 winning stock portfolios chosen by our advanced AI. In 2024 alone, ProPicks AI identified 2 stocks that surged over 150%, 4 additional stocks that leaped over 30%, and 3 more that climbed over 25%. Which stock will be the next to soar?
Unlock ProPicks AI