
T2108 Status: 68.2% (ends a 10-day overbought period)
VIX Status: 12.9 (surprisingly flat)
General (Short-term) Trading Call: Stay short.
Active T2108 periods: Day #90 over 20% (overperiod), Day #3 under 70%
Commentary
In the last T2108 Update, I declared that the potential for an extended overbought rally had ended. T2108 dropped below the 70% overbought threshold and history demonstrates that such a drop tends to presage a notable sell-off for the S&P 500 (SPY). Friday’s weak start to the month seemed to confirm the downside risk; for a good while, it seemed that the month would even fail to start with an upside trading day. This second day of trading for the month delivered small follow-through buying, and T2108 is back to scratching at overbought levels.
If T2108 returns again to overbought levels, I will have to start the clock all over. My ProShares Ultra S&P 500 (SSO) puts would then be very likely to expire next week worthless. However, I will also be far away from replacing (or hedging) them with SSO calls. In other words, a return to overbought levels would likely usher in a pretty quiet month of (T2108) trading for me.
The next big milestone is post-Black Friday trading. Amazingly enough, the bullish setup from 2012 remains intact….and 2011′s bullish signal seems like it will be safe for years to come! I will write an update on this trade in the next week or so.
I end with my chart of the day: Facebook (FB). This chart seems timely with the IPO of Twitter (TWTR) coming up this Thursday (Nov 7th). FB made a valiant attempt to recover from a post-earnings dip to 50DMA support. Sellers have quickly returned the last two days, perhaps cashing in to prepare to buy TWTR shares, sending FB close to another retest of support. As the lower-Bollinger Band begins to turn downward, I doubt this retest will succeed. Just in case, I bought another round of FB calls to hedge my on-going short position. Last week’s earnings demonstrated exactly what I talked about earlier to justify my short position: at any time, at any earnings call, the company can and will disappoint extremely high expectations.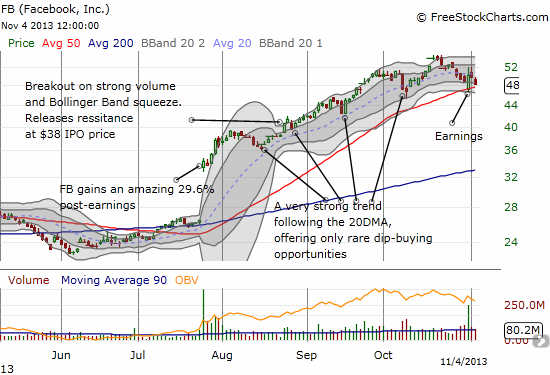
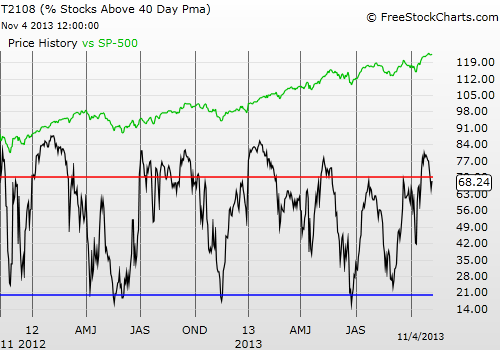
Black line: T2108 (measured on the right); Green line: S&P 500 (for comparative purposes)
Red line: T2108 Overbought (70%); Blue line: T2108 Oversold (20%)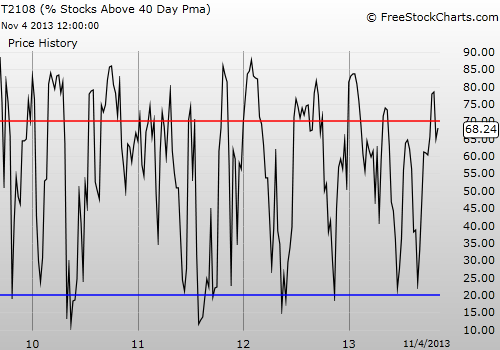
Be careful out there!
Full disclosure: long SSO puts, short FB shares, long FB puts
Which stock should you buy in your very next trade?
AI computing powers are changing the stock market. Investing.com's ProPicks AI includes 6 winning stock portfolios chosen by our advanced AI. In 2024 alone, ProPicks AI identified 2 stocks that surged over 150%, 4 additional stocks that leaped over 30%, and 3 more that climbed over 25%. Which stock will be the next to soar?
Unlock ProPicks AI