
T2108 Status: 63.3% (ends a 10-day overbought period)
VIX Status: 12.7 (surprisingly flat)
General (Short-term) Trading Call: Stay short.
Active T2108 periods: Day #92 over 20% (overperiod), Day #5 under 70%
Commentary
A strange divergence has unfolded between T2108 and the S&P 500 (SPY). Ever since the last overbought period ended, T2108 has steadily moved lower…as expected. However, the S&P 500 has not followed as expected. At the end of today’s trading the S&P 500 traded within a hair of its all-time high, and it is a hair higher than its value at the end of the last overbought period.
Normally, I would call this a bearish divergence, but I have learned my lesson from previous episodes of divergence. What makes this one so strange is that recent history shows that the end of the overbought period tends to generate a sell-off, sometimes substantial. If you had asked me last week, I would have told you that the S&P 500 would only go higher if T2108 quickly returned to overbought levels. With T2108 drifting away from overbought levels, I am on the edge of my seat waiting for a resolution. I am still betting on follow-through selling.
As my puts on S&P 500 Ultra Shares (SSO) slowly shrivel away, I find the T2108 trade completing an incredible run this year. It is more reminiscent of the amazing success T2108 had in 2011 when the market was kind enough to deliver multiple oversold episodes that proved to be very buyable. This was also the year that I removed the automatic bearish signal from overbought conditions. For example, if T2108 manages to flip overbought again in the next week or so, I will likely try chasing SSO higher for a brief spell.
There is only one main negative that I see on the horizon at this point. Surprisingly, interest rates are creeping higher again. This increase looks like noise so far until rates make a new high (also note below that mortgage rates have not joined bond rates higher). Since emerging market stocks have come in recent days, I am once again watching rates closely.
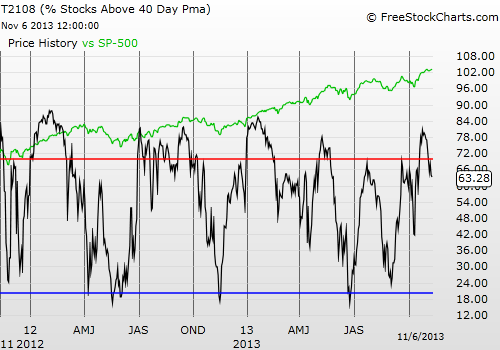
Black line: T2108 (measured on the right); Green line: S&P 500 (for comparative purposes)
Red line: T2108 Overbought (70%); Blue line: T2108 Oversold (20%)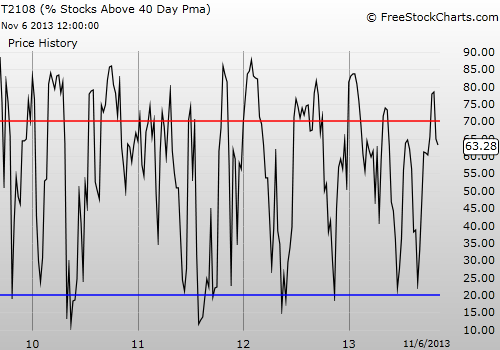
Be careful out there!
Full disclosure: long SSO puts, long calls and puts on EEM and TLT
Which stock should you buy in your very next trade?
With valuations skyrocketing in 2024, many investors are uneasy putting more money into stocks. Unsure where to invest next? Get access to our proven portfolios and discover high-potential opportunities.
In 2024 alone, ProPicks AI identified 2 stocks that surged over 150%, 4 additional stocks that leaped over 30%, and 3 more that climbed over 25%. That's an impressive track record.
With portfolios tailored for Dow stocks, S&P stocks, Tech stocks, and Mid Cap stocks, you can explore various wealth-building strategies.