
SunTrust Banks, Inc.'s (NYSE:STI) third-quarter 2017 earnings of $1.06 per share were in line the Zacks Consensus Estimate. Also, the figure was up 16% year over year.
Results were primarily driven by an increase in net interest income and a slight fall in operating expenses. Also, stable loan balance and an increase in deposits supported the results. However, a rise in provision for credit losses and lower non-interest income (mainly owing to mortgage banking woes) were the headwinds.
Net income available to common shareholders was $512 million, up 12% from the prior-year quarter.
Net Interest Income Growth Offsets Higher Costs
Total revenues (FTE basis) for the quarter grew 4% from the prior-year period to $2.31 billion. The figure was above the Zacks Consensus Estimate of $2.29 billion.
Net interest income (FTE basis) increased 9% year over year to $1.47 billion. The rise was attributable to growth in average earning assets and higher earning asset yields.
On a year-over-year basis, net interest income was up 19 basis points (bps) to 3.15%, reflecting higher earning asset yields and lower premium amortization in the securities portfolio. This was partly offset by higher rates paid on interest-bearing liabilities.
Non-interest income was $846 million, down 5% from the prior-year quarter. The fall was largely due to lower mortgage related income, partially offset by a rise in investment banking income.
Non-interest expenses were down 1% from the year-ago quarter to $1.39 billion. The fall was mainly due to a lower outside processing and software costs.
Credit Quality Improved
Total non-performing assets were $792 million as of Sep 30, 2017, down 22% from prior-year quarter. Non-performing loans fell 19 bps year over year to 0.48% of total loans held for investment.
Further, the rate of net charge-offs decreased 14 bps year over year to 0.21% of total average loans held for investment. However, provision for credit losses increased 24% from the year-ago quarter to $120 million reflecting anticipated losses from hurricanes.
Strong Balance Sheet
As of Sep 30, 2017, SunTrust had total assets of $208.3 billion while shareholders’ equity was $24.5 billion, representing nearly 12% of total assets.
As of Sep 30, 2017, loans held for investments were relatively stable on a sequential basis at $144.3 billion. Total consumer and commercial deposits grew nearly 2% from the prior quarter to $161.8 billion.
SunTrust’s estimated common equity Tier 1 ratio under Basel III (on a fully phased-in basis) was 9.62% as of Sep 30, 2017.
Share Repurchase
During the reported quarter, the company bought back shares worth $330 million.
Our Viewpoint
SunTrust remains well positioned for growth given its favorable deposit mix and enhanced credit quality. Easing margin pressure and initiatives to enhance efficiency should support the company’s revenues.
However, the company’s significant exposure to commercial and residential loan portfolios remains a major near-term concern. Also, slowdown in mortgage business makes us apprehensive.
SunTrust Banks, Inc. Price, Consensus and EPS Surprise
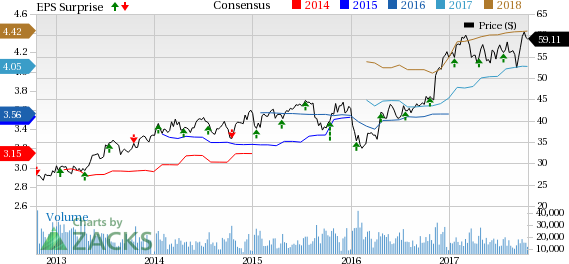
SunTrust Banks, Inc. Price, Consensus and EPS Surprise | SunTrust Banks, Inc. Quote
SunTrust currently carries a Zacks Rank #3 (Hold). You can see the complete list of today’s Zacks #1 Rank (Strong Buy) stocks here.
Performance of Other Major Regional Banks
B&T Corporation’s (NYSE:BBT) third-quarter 2017 adjusted earnings came in line with the Zacks Consensus Estimate. Results reflected an increase in revenues and higher expenses. Additionally, provision for credit losses decreased, which was a tailwind.
Comerica Incorporated’s (NYSE:CMA) adjusted earnings per share surpassed the Zacks Consensus Estimate. Results reflected increase in revenues supported by easing margin pressure and higher fee income. Also, the company was successful in reducing expenses on the back of its GEAR Up initiative. However, higher provisions and a fall in loans balance remained major headwinds.
KeyCorp’s (NYSE:KEY) third-quarter 2017 adjusted earnings were in line with the Zacks Consensus Estimate. Results were supported by revenue synergies from the First Niagara Financial Group acquisition deal (completed in August 2016) and higher interest rates. Further, lower credit cost, an increase in fee income, and improving loans and deposits were the tailwinds. On the other hand, higher operating expenses were on the downside.
Wall Street’s Next Amazon (NASDAQ:AMZN)
Zacks EVP Kevin Matras believes this familiar stock has only just begun its climb to become one of the greatest investments of all time. It’s a once-in-a-generation opportunity to invest in pure genius.
Click for details >>
BB&T Corporation (BBT): Free Stock Analysis Report
Comerica Incorporated (CMA): Free Stock Analysis Report
SunTrust Banks, Inc. (STI): Free Stock Analysis Report
KeyCorp (KEY): Free Stock Analysis Report
Original post