Stock market today: S&P 500 ekes out gain as Trump says open to deals on tariffs
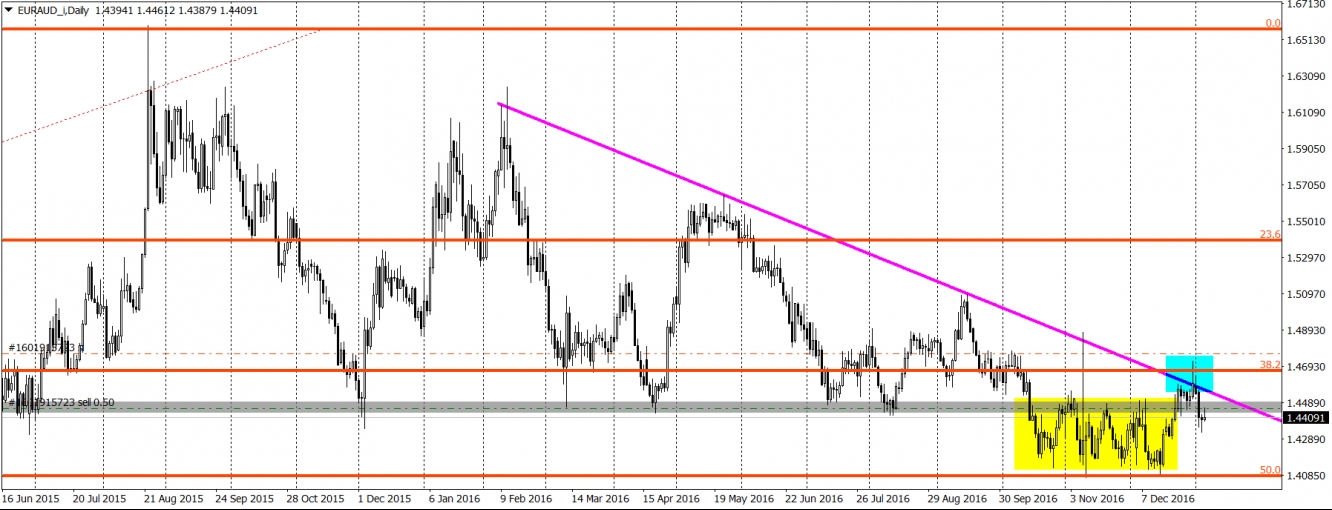
For our first analysis in the 2017 we have for you a real technical combo. Although EUR/AUD is not a very popular instrument, is very technical and now gives us signs that in the mid-term, this pair will be aiming lower.
First of all, we had a nice bounce from the down trendline (purple) which was also made by two shooting starts (bearish candles with the long heads). What is more, this attack on the trendline was, as we can see now, a false breakout. To be precise it was a false breakout of the horizontal resistance (1.448 grey area) and from the mid-term rectangle (yellow area).
Both those factors (rectangle and horizontal resistance), where giving us sell signal so breaking it was a potential bullish factor. That is why, when that bullish initiative fails (now) it creates a great opportunity for a movement in the opposite direction (south). In addition to this, the price is still making lower highs and lower lows, which is characteristic for the downtrend. As we can see, when combining all that signals, odds for a downswing are higher than for the upswing and this is exactly our view for this pair for the next few days/weeks.

Which stock should you buy in your very next trade?
With valuations skyrocketing in 2024, many investors are uneasy putting more money into stocks. Unsure where to invest next? Get access to our proven portfolios and discover high-potential opportunities.
In 2024 alone, ProPicks AI identified 2 stocks that surged over 150%, 4 additional stocks that leaped over 30%, and 3 more that climbed over 25%. That's an impressive track record.
With portfolios tailored for Dow stocks, S&P stocks, Tech stocks, and Mid Cap stocks, you can explore various wealth-building strategies.
