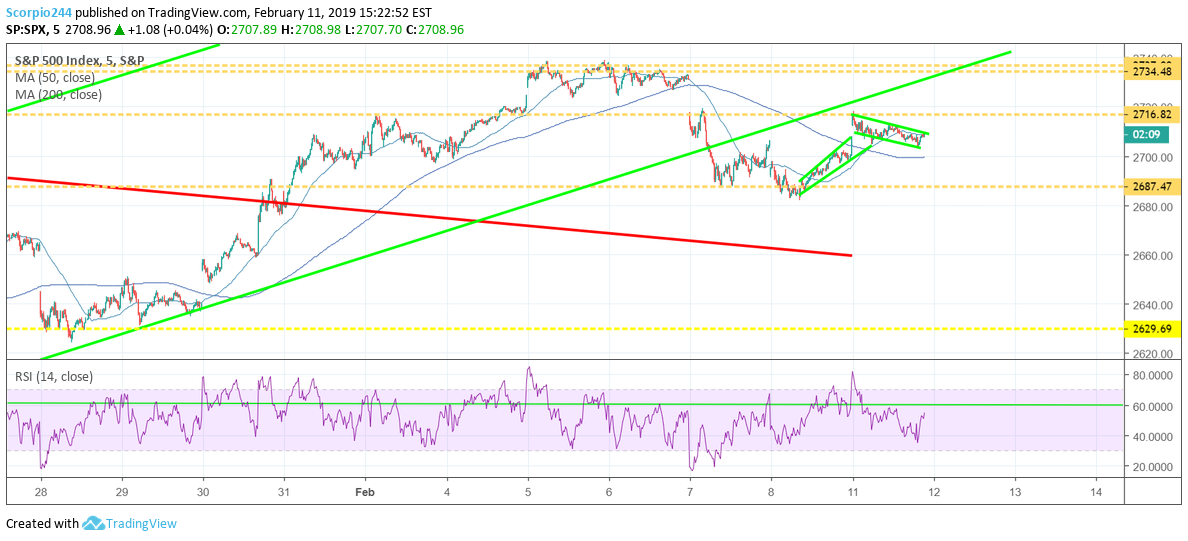
Stocks had a rather quiet day with the S&P 500 flat. The good news is that stock held their gains for the late-day rally on Friday. The bad news, the index is struggling to rise above 2,716.
The index moved and failed right at resistance at the start of the day. It is consolidating nicely at these prices, and it seems to be forming a bullish flag, a continuation pattern. It would suggest to me we do rise above resistance at 2,716, and test 2,730, while also filling that gap from last week — more on gaps to come.
Russell 2000 (IWM)
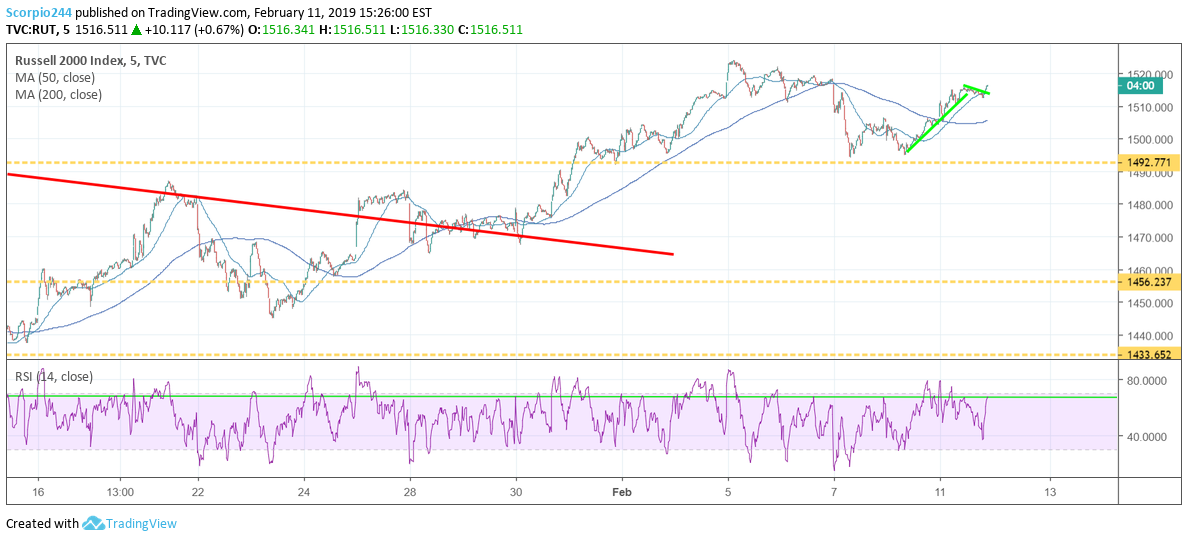
We can see that a similar setup in the Russell 2000 came and went, with the Russell breaking out and on the way back to 1,524.
So it seems to me that the S&P 500 is going to be more than fine going forward. I think last weeks sell-off on Thursday was nothing but noise. It looks like I have been proven correct, although I could be proven wrong tomorrow.
Tesla (TSLA)
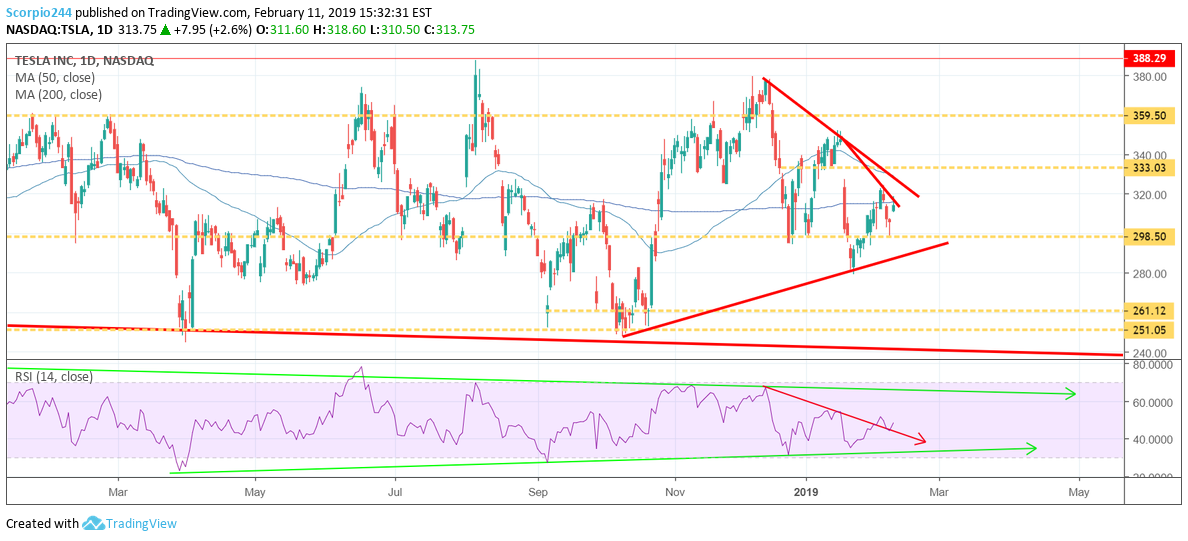
The Tesla Inc (NASDAQ:TSLA) stock is having a tough time getting over the $318. It appears that there may be a downtrend in place, which surprising to me. The RSI continues to point to higher prices, so I am sticking with a bullish outlook on the stock and rise back towards $333.
Amazon (AMZN)
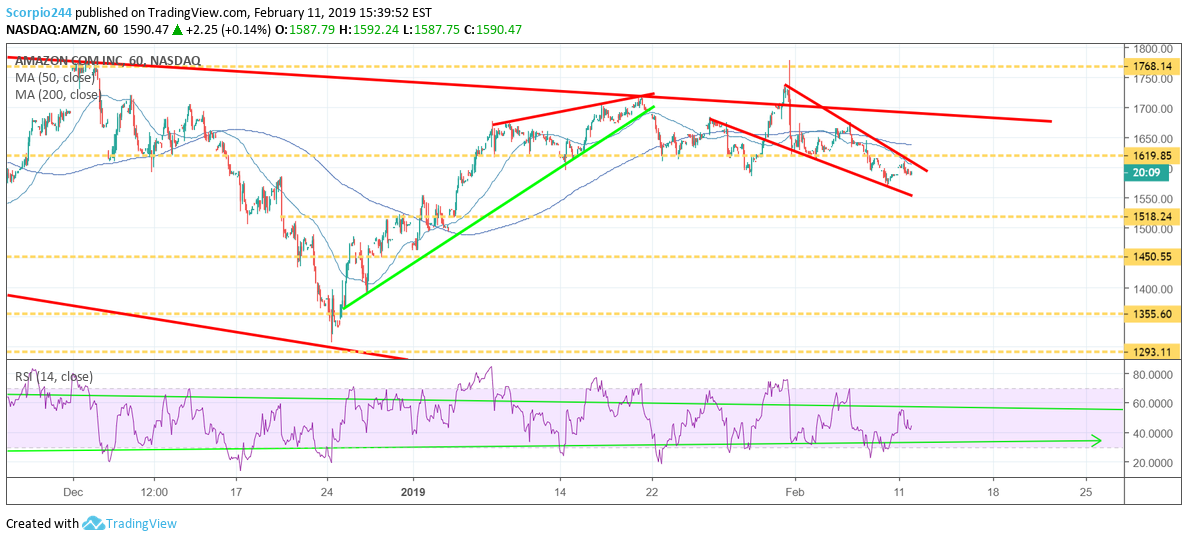
Don’t get too excited if you have Amazon.com Inc (NASDAQ:AMZN); I have some bad news for you. The stock is struggling at this $1620-ish level. The RSI has a clear trend, and it isn’t higher –that’s for sure.
But here’s the thing, the RSI is more of a long-term trend lower. What I am seeing now is that the stock has the potential to rise with that falling wedge. It suggests Amazon could break out and first rise to around $1680 before moving lower again.
Nvidia (NVDA)
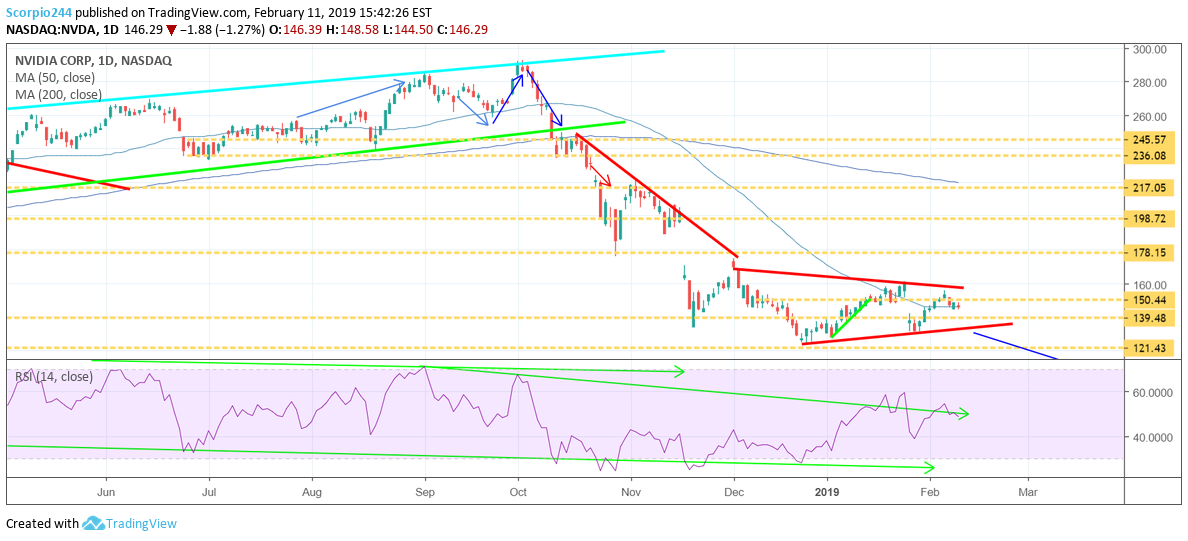
NVIDIA Corporation (NASDAQ:NVDA) reports on Friday, and as I noted this morning, the setup looks pretty bad.
Activision (ATVI)
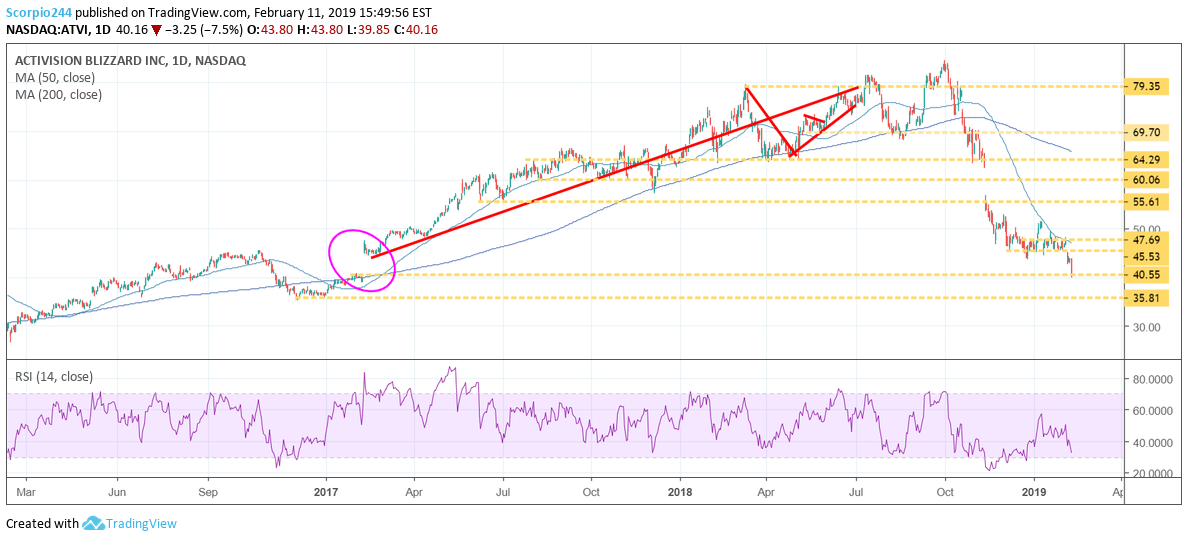
Activision Blizzard Inc (NASDAQ:ATVI), gap filled! Next stop $35.80?
Goldman (GS)
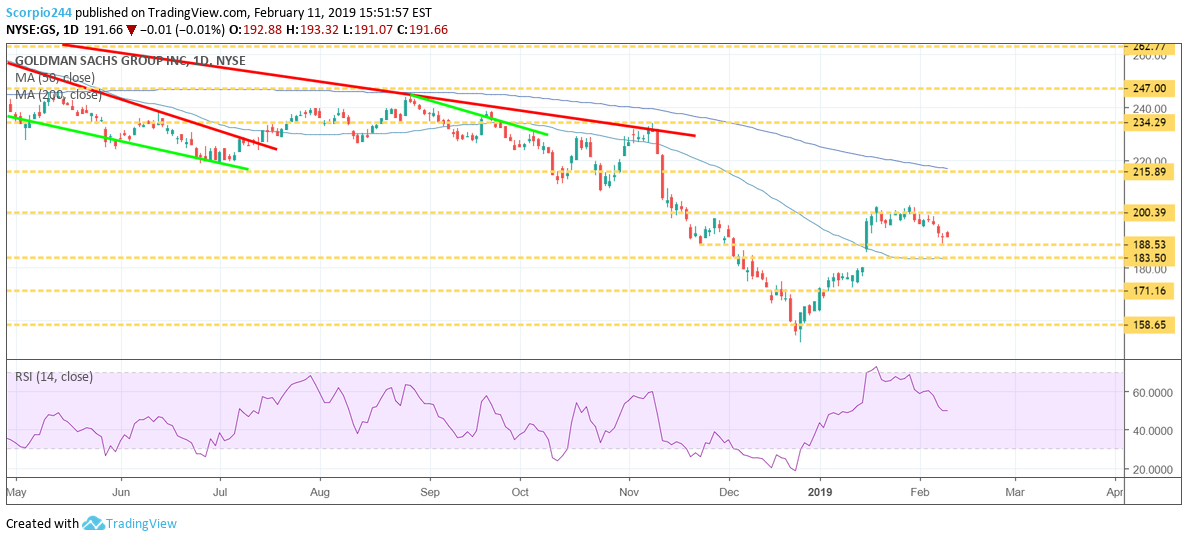
Do all gaps get filled? Watch out Goldman Sachs Group Inc (NYSE:GS) $183 is on the horizon.
Morgan Stanley (MS)
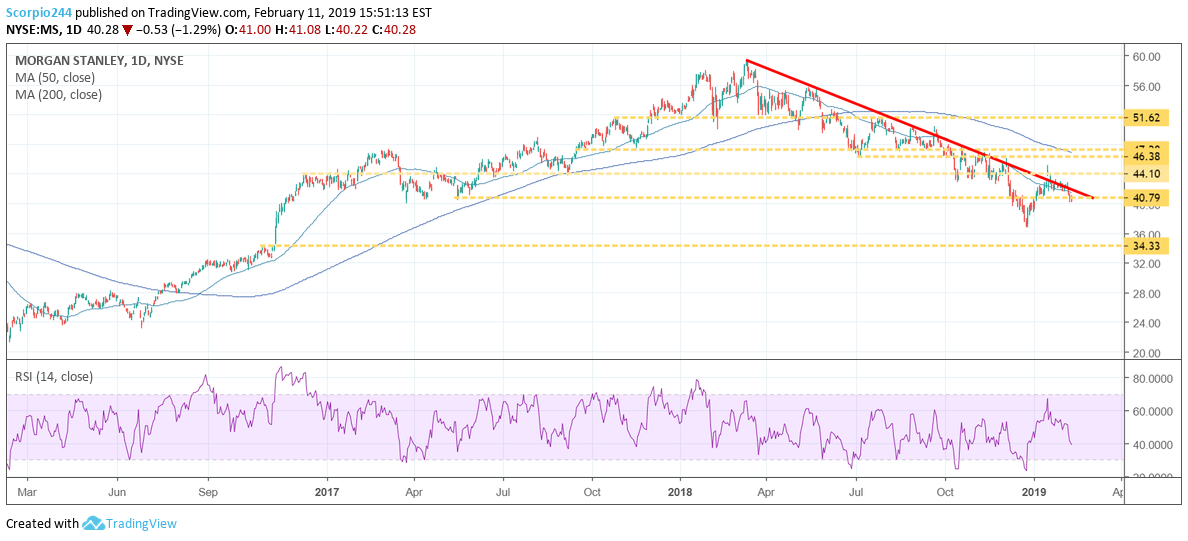
Can you believe that Morgan Stanley (NYSE:MS) is on the verge of a breakdown that could result in the stock retesting its Christmas Eve lows?
Inflation
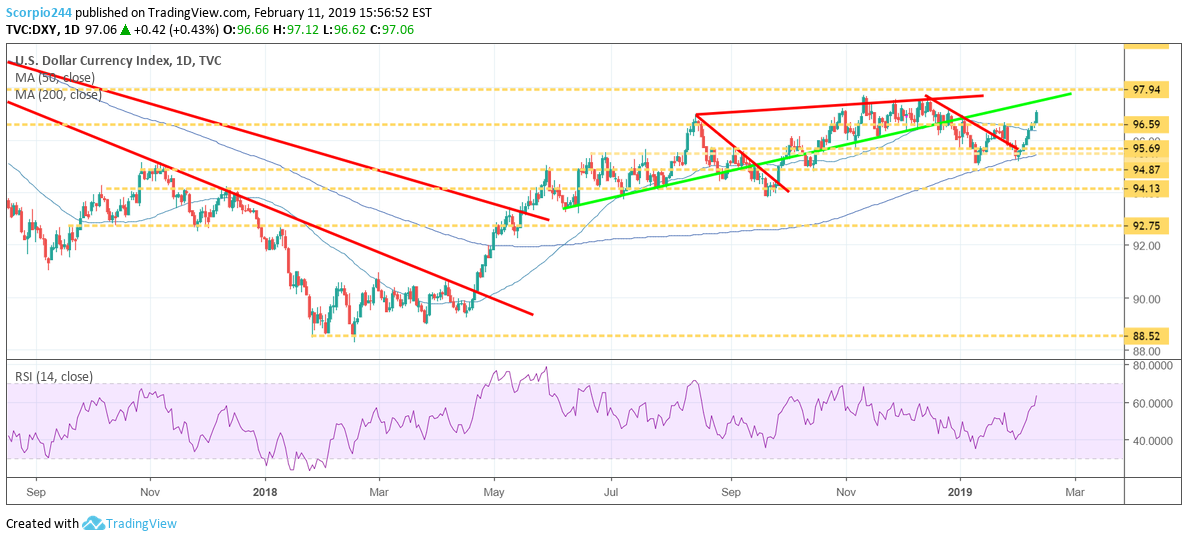
Watch out inflation; the dollar is on the move. That looks like a double bottom in the dollar index and that means we may be seeing a rise back to 100 on the index soon. Kiss your inflation worries goodbye, and forget about any more rate hikes in 2019, should the dollar keep going up. Draghi wins again. What will the ECB do when his term is over?
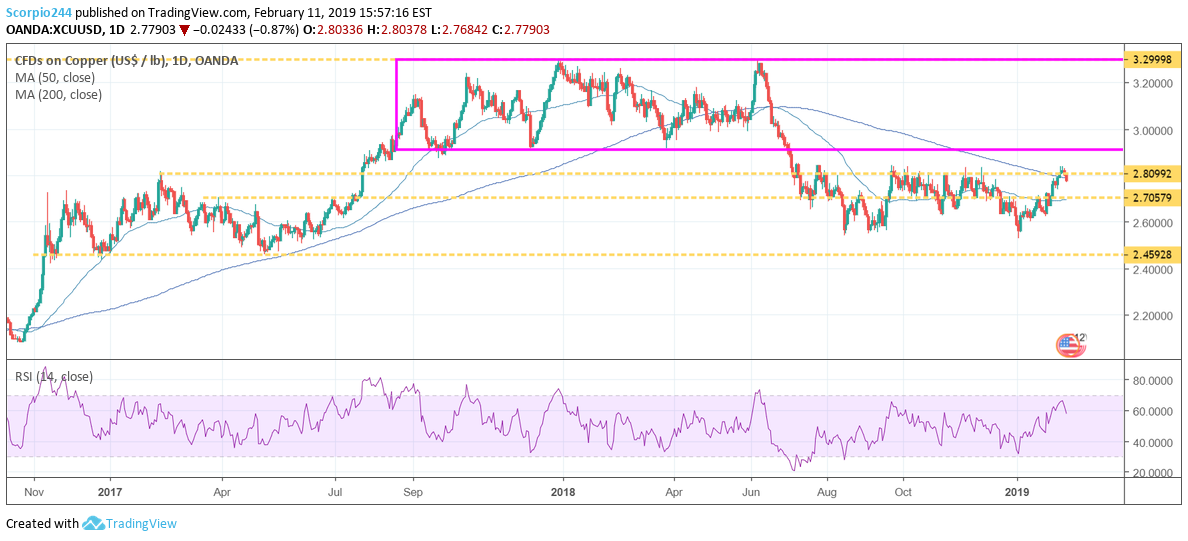
It means that how copper trades will be even more critical because a strong dollar should weaken copper prices. So if copper should continue to rise, it tells us something about global growth.
Disclaimer: Michael Kramer and the clients of Mott Capital own Tesla

