Stocks are pointing to higher opening today, regaining some of its losses from yesterday. It seems a bit confusing to me at the moment in terms of what happens next, because there is so much going on at this point. The momentum is clearly behind stocks rising, but at the same time, the disconnect from what is happening in the market place and the economy grows more significant. The risk/reward ratio appears to favor the downside and not the upside.
S&P 500 (SPY)
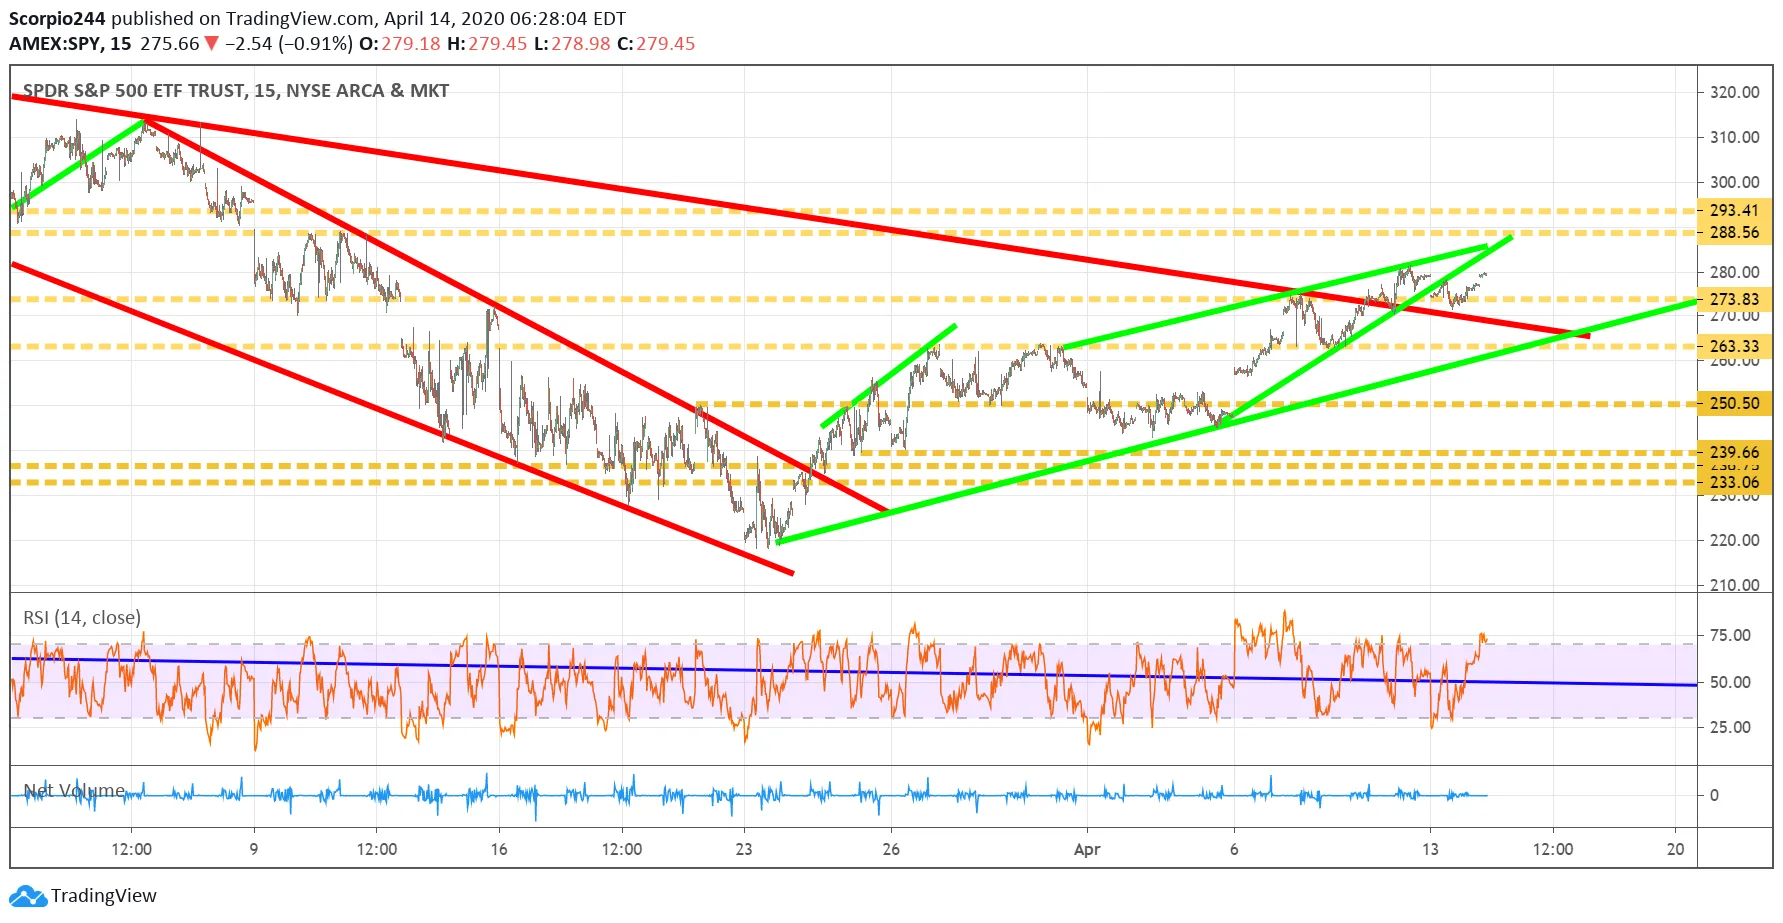
The technical setup in the S&P 500 continues to indicate that stocks are likely to move lower towards $263 on the SPDR S&P 500 (NYSE:SPY) But we can wait and see; the markets don’t seem to agree with me lately.
QQQ
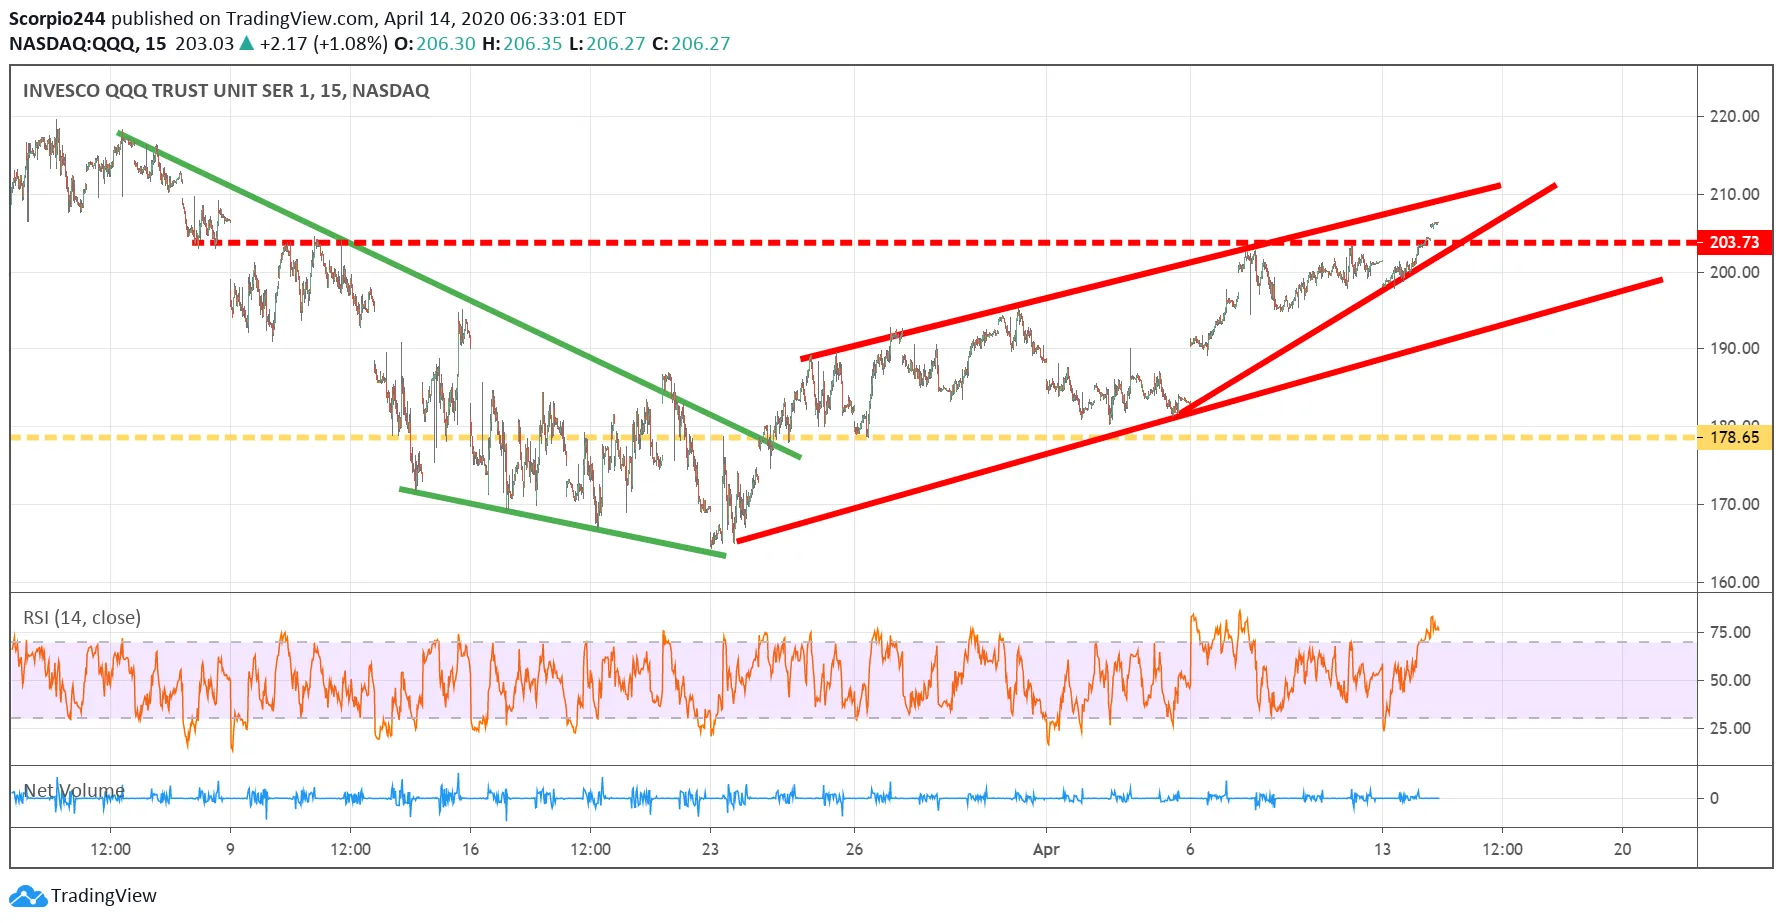
The QQQ (NASDAQ:QQQ) is also showing some signs of fatigue, with two bearish patterns forming, a bump and run, and a rising wedge pattern. It would indicate that the ETF falls to around $192.
So we can wait and see what happens.
Johnson and Johnson (JNJ)
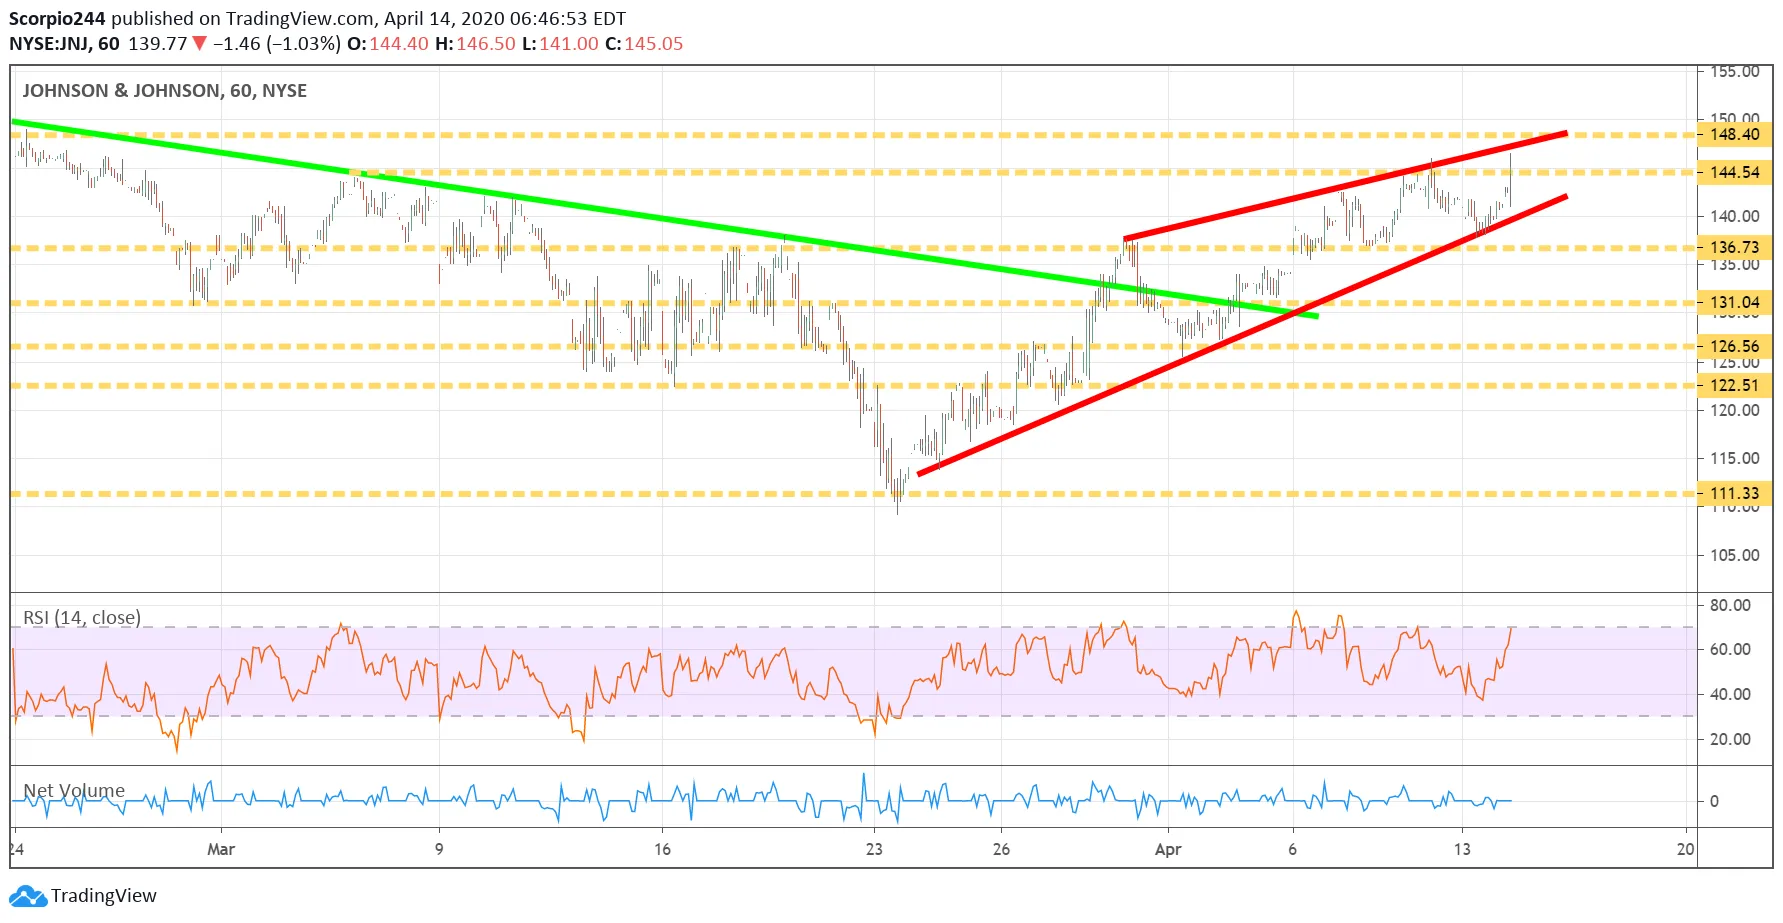
Johnson & Johnson (NYSE:JNJ) reported better than expected earnings and revenue. But the guidance was cut, as widely expected. The company now sees earnings of $7.70 at the midpoint of the range, versus prior guidance of around $9.03 at the mid-point. Analysts had been looking for earnings of $8.08. The stock is rising by about 4%, so perhaps it is better than the whisper number, but still, resistance appears to be around the $144 to $145 region. The pattern in JNJ isn’t all that different then what we have seen in the S&P 500.
JPMorgan
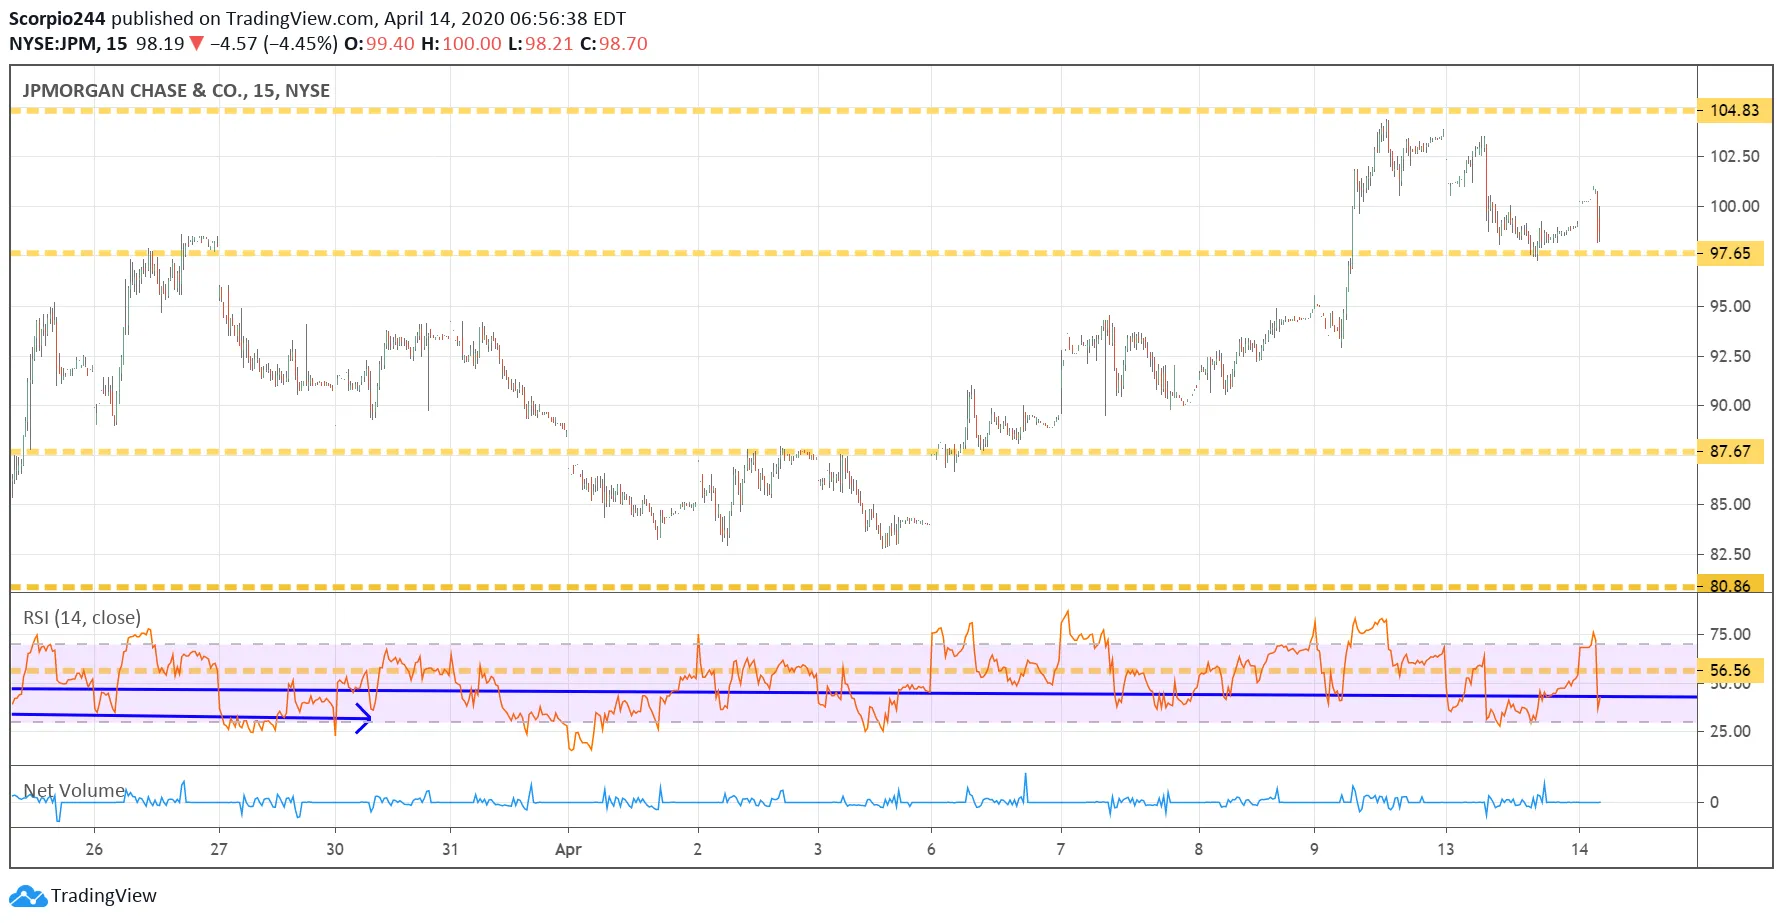
JPMorgan (NYSE:JPM) reported results that missed on both the top and bottom line. It will be what the company talks about on the conference call. At the moment, the stock is unchanged, and should it fall below $97.50; the stock could fall to around $87.50.
Bank of America (NYSE:BAC)
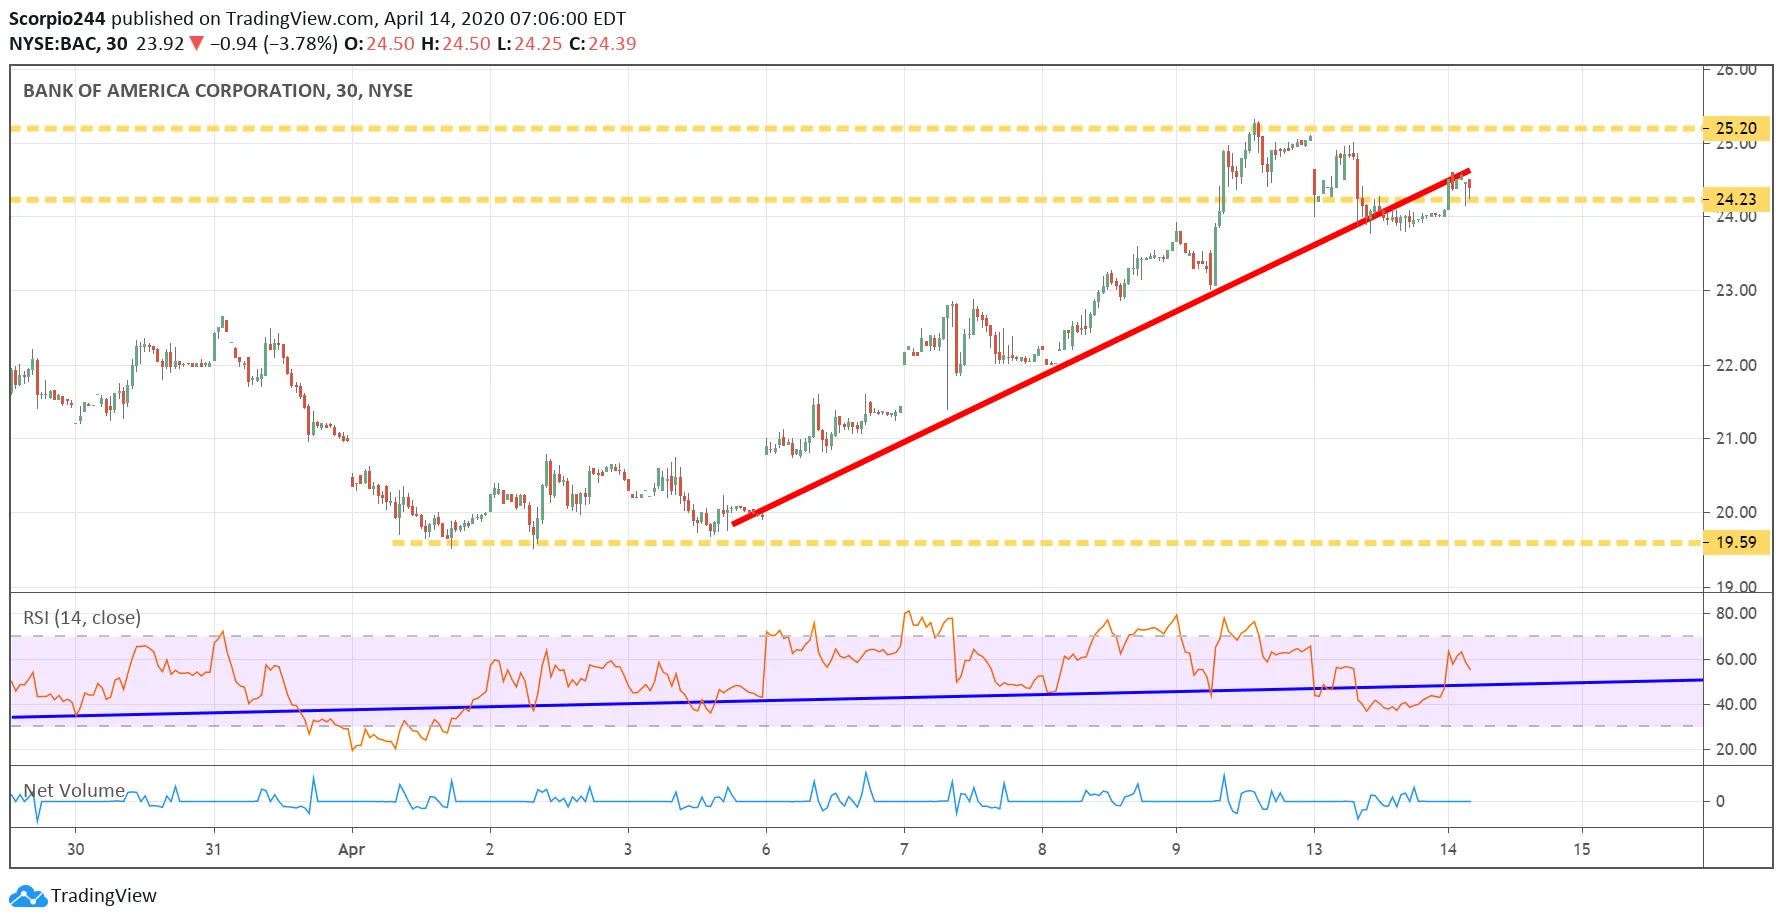
Bank of America will report tomorrow, and this stock has fallen below an uptrend and is sitting on support at $24.25. I had seen some bearish betting in BAC yesterday, and the chart indicates the stock could fall to $19.50. Free article Bank Of America’s Stock May Drop Sharply After Results
Intel
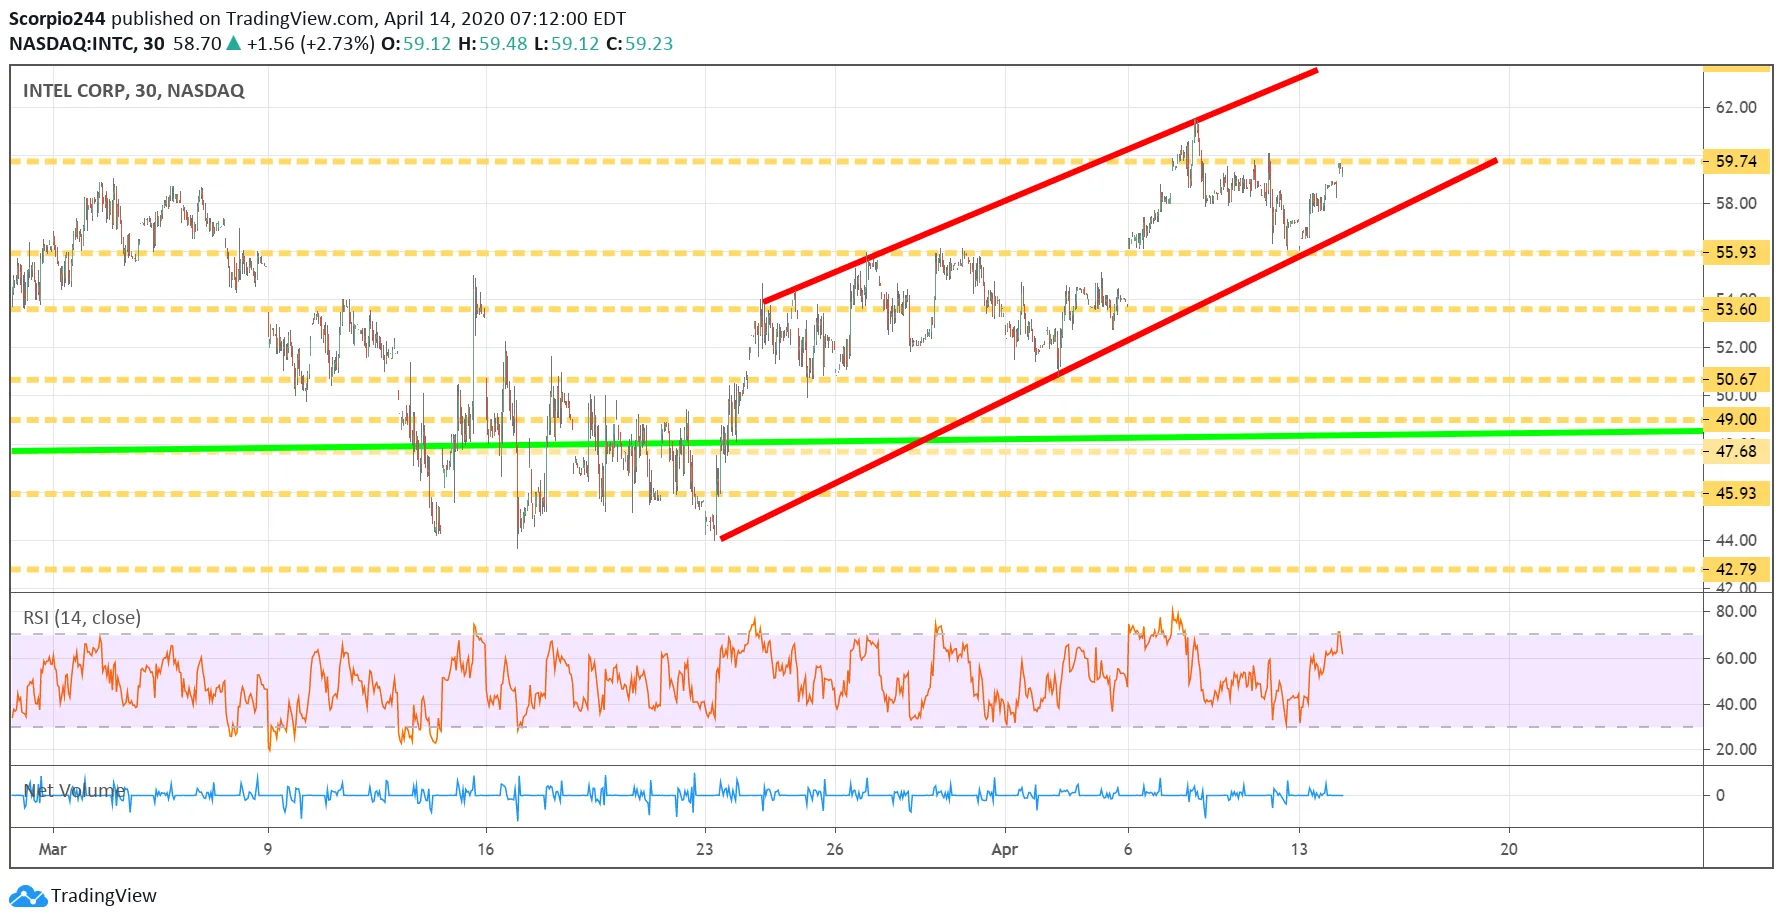
Intel (NASDAQ:INTC) is rising in a trading channel and is now trading at resistance at $59.75, and is moving towards the lower end of the range. A break below $56 sets up a drop to $53.60.
Which stock should you buy in your very next trade?
AI computing powers are changing the stock market. Investing.com's ProPicks AI includes 6 winning stock portfolios chosen by our advanced AI. In 2024 alone, ProPicks AI identified 2 stocks that surged over 150%, 4 additional stocks that leaped over 30%, and 3 more that climbed over 25%. Which stock will be the next to soar?
Unlock ProPicks AI
