Stock market today: S&P 500 in fifth straight record close as earnings shine

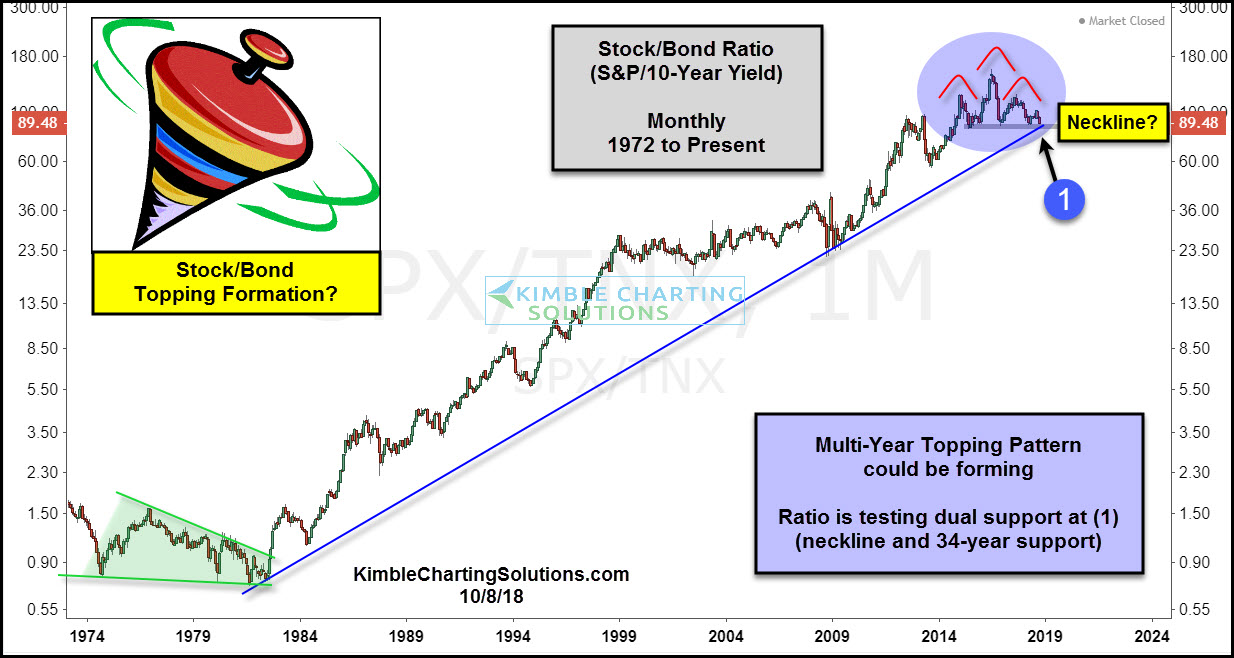
This chart compares the relative strength of Stocks to bonds by creating the S&P 500/10-Year yield ratio (SPX/TNX) on a monthly basis, since the mid-1970s.
The stock/bond ratio’s trend has been up for the past 34-years, following a resistance breakout in the early 1980s. Nothing of late has changed this long-term bullish trend, which is experiencing a major support test right now at (1).
Over the past 3 years, the ratio has traded sideways, where it could be creating a head-and-shoulders topping pattern. Softness in the ratio of late has it testing 34-year rising support and potential neckline support at the same time at (1).
At this time, support is support. If it fails to hold, it would suggest a long-term trend change is in play.
What the ratio does with support will send very a very important message to stocks, bonds and asset allocation models!
Which stock should you buy in your very next trade?
AI computing powers are changing the stock market. Investing.com's ProPicks AI includes 6 winning stock portfolios chosen by our advanced AI. In 2024 alone, ProPicks AI identified 2 stocks that surged over 150%, 4 additional stocks that leaped over 30%, and 3 more that climbed over 25%. Which stock will be the next to soar?
Unlock ProPicks AI