Asia stocks tread water as tariff concerns persist; Tech eyes TSMC earnings
Briefly: In our opinion, speculative short positions are favored (with stop-loss at 2,140, and profit target at 2,100, S&P 500 index).
Our intraday outlook is now bearish, and our short-term outlook is bearish. Our medium-term outlook remains bearish, as the S&P 500 index extends its lower highs, lower lows sequence:
Intraday outlook (next 24 hours): bearish
Short-term outlook (next 1-2 weeks): bearish
Medium-term outlook (next 1-3 months): bearish
Long-term outlook (next year): neutral
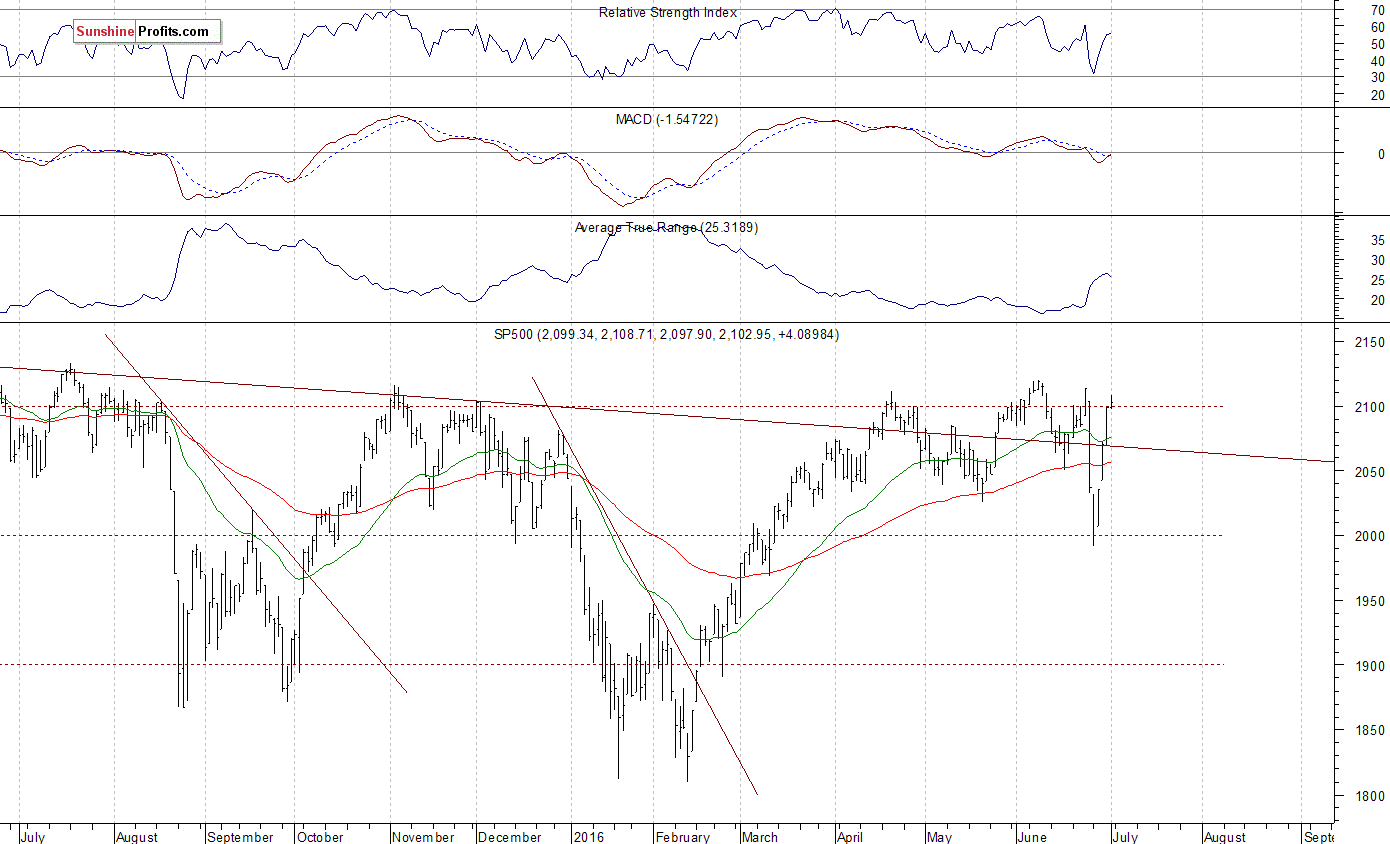
The main U.S. stock market indexes gained 0.1-0.5% on Friday, extending their short-term uptrend, as investors reacted to economic data releases, among others. The S&P 500 index broke slightly above the level of 2,100, as it retraced its "Brexit" selloff. The nearest important level of resistance is at 2,110-2,120, marked by last month's local highs. The next resistance level is at around 2,130-2,135, marked by last year's all-time high of 2,134.72. On the other hand, support level is at around 2,080-2,085, marked by previous level of resistance, and the next level of support is at 2,050-2,070. Last year's highs along the level of 2,100 continue to act as medium-term resistance level. Is this some long-term topping pattern or just medium-term consolidation following a rebound off February low?
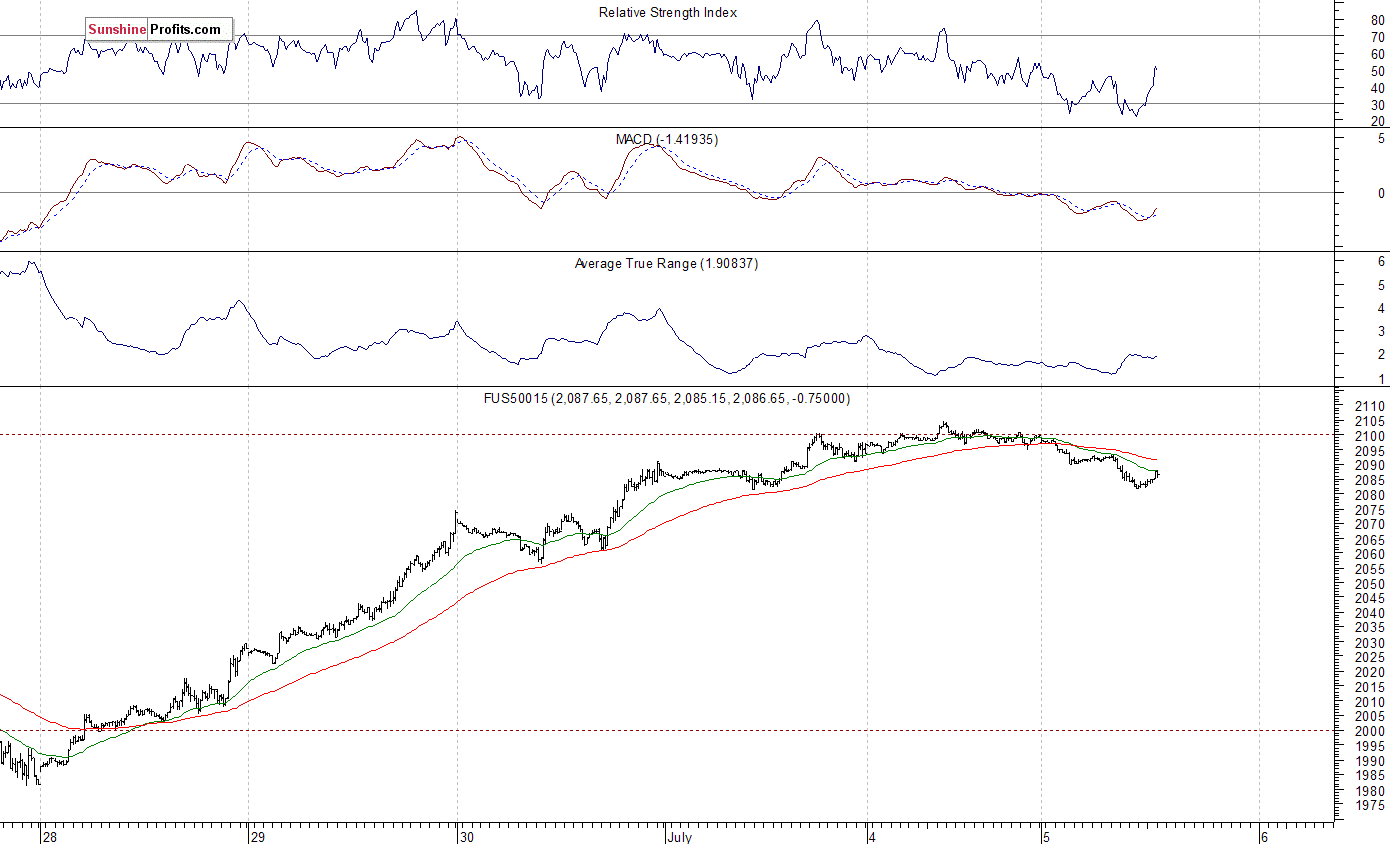
Expectations before the opening of today's trading session are negative, with index futures currently down 0.4-0.5%. The European stock market indexes have been mixed so far. Investors will now wait for the Factory Orders number release at 10:00 a.m. The S&P 500 futures contract trades within an intraday downtrend, as it retraces some of its recent advance. The nearest important level of support is at around 2,080. On the other hand, resistance level is at 2,090-2,095, marked by an intraday local high, as we can see on the 15-minute chart:
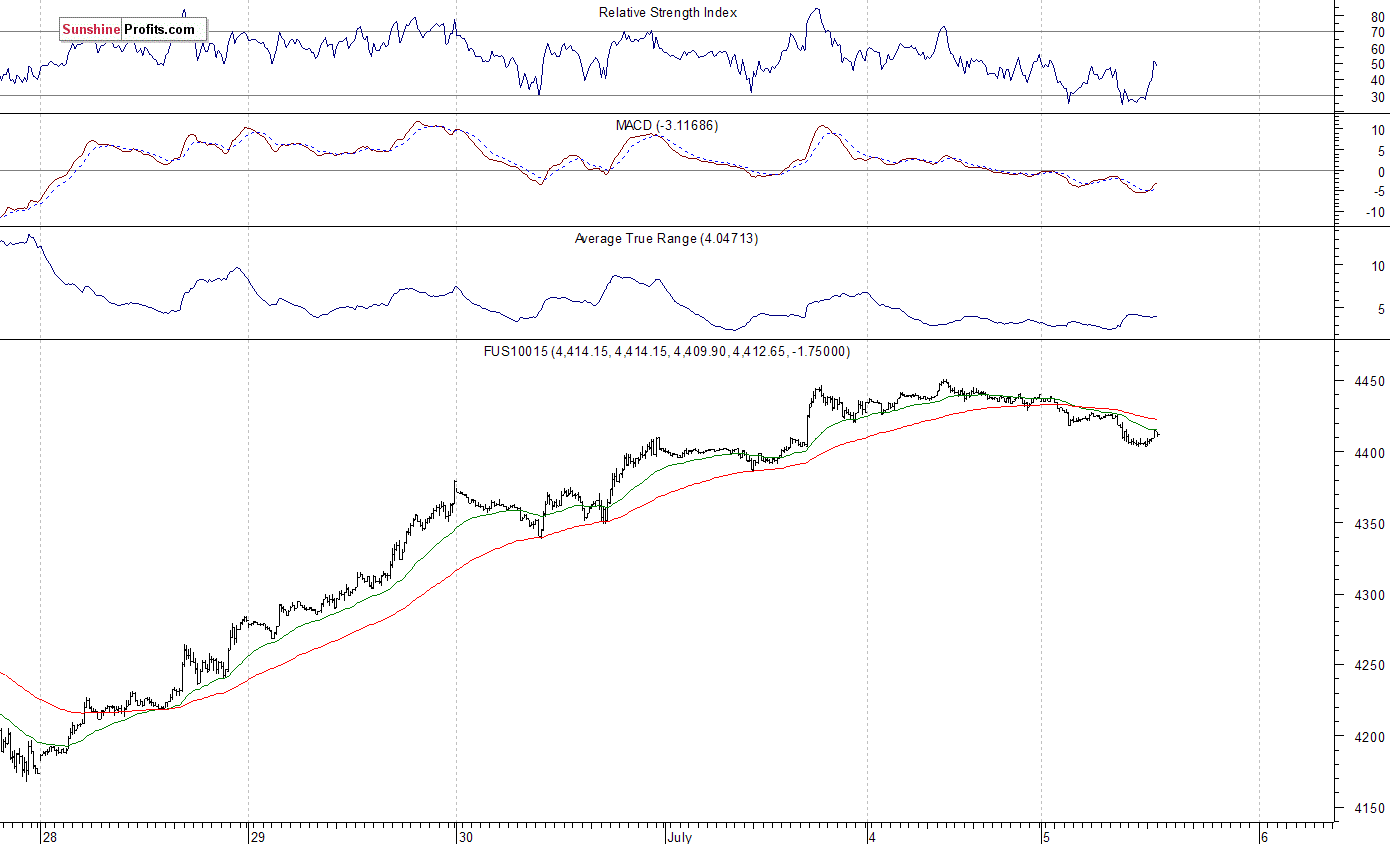
The technology Nasdaq 100 futures contract follows a similar path, as it currently trades closer to the level of 4,400. It retraces some of its last week's rally. The nearest important level of support remains at 4,400, and resistance level is at 4,430, marked by an intraday local high, as the 15-minute chart shows:
Concluding, the broad stock market extended its rally on Friday, as the S&P 500 index retraced its "Brexit" selloff. We can see short-term overbought conditions accompanied by some bearish technical divergences. Therefore, we decided to open a speculative short position at the opening of today's cash market trading session (S&P 500 index). Stop-loss level is at 2,140 and potential profit target is at 2,000 (S&P 500 index). You can trade S&P 500 index using futures contracts (S&P 500 futures contract - SP, E-mini S&P 500 futures contract - ES) or an ETF like the SPDR S&P 500 ETF (NYSE:SPY) - SPY. It is always important to set some exit price level in case some events cause the price to move in the unlikely direction. Having safety measures in place helps limit potential losses while letting the gains grow.
Which stock should you buy in your very next trade?
With valuations skyrocketing in 2024, many investors are uneasy putting more money into stocks. Unsure where to invest next? Get access to our proven portfolios and discover high-potential opportunities.
In 2024 alone, ProPicks AI identified 2 stocks that surged over 150%, 4 additional stocks that leaped over 30%, and 3 more that climbed over 25%. That's an impressive track record.
With portfolios tailored for Dow stocks, S&P stocks, Tech stocks, and Mid Cap stocks, you can explore various wealth-building strategies.


