Analyst flags 9 bargain stocks in a ‘Black Friday’-style dip
Earlier this year, the risk/reward profile of the stock market entered the worst one percentile of all historical observations based on our analysis of 80 years of fundamental, technical and internal data. Fund manager John Hussman has reported similar findings during 2012 and his latest weekly commentary indicated that his measure of stock market risk has increased to the highest level on record based on 100 years of data.
Don't Overestimate The Warning
As of Friday, our estimates of prospective return/risk for the S&P 500 had dropped to the single lowest point we’ve observed in a century of data. There is no way to view this as something other than a warning, but it’s also a warning that I don’t want to overstate. This is an extreme data point, but there has been no abrupt change; no sudden event; no major catalyst. We are no more defensive today than we were a week ago, because conditions have been in the most negative 0.5% of the data for months. This is just the most negative return/risk estimate we’ve seen. It is what it is.
Since we estimate prospective return/risk on a blended horizon of two-weeks to 18 months, we are not making a statement about the very long-term, but only about intermediate-term horizons (prospective long-term returns have certainly been worse at some points, such as 2000). As always, our estimates represent the average historical outcome that is associated with a given set of conditions, and they don’t ensure that any particular instance will match that average. So while present conditions have been followed by extraordinarily poor market outcomes on average, there’s no assurance that this instance can’t diverge from typical outcomes. Investors should ignore my concerns here if they believe that the proper way to invest is to bet that this time is different.
In March of this year, our estimates dropped into the worst 2% of historical observations, then fell to the lowest 0.5% of all observations by April. Note that the only way to achieve an extremely overbought market is for prices to move up through less extreme overbought conditions, without consequence. Likewise, the only way for market conditions to become as extreme as they are at present was for the market to advance despite progressively worsening conditions, without consequence. So we have been wrong, and uncomfortably so, during this advance. The bet of investors, of course, is that global central banks can provide a panacea against the consequences of the rich valuations and excessive debt burdens that those same central banks are responsible for encouraging. Again, investors should ignore my concerns here if they believe that present market levels do not adequately reflect and discount those hopes, or are convinced that these hopes are sufficient to negate other historical evidence.
What We Aren't Saying
In saying that our prospective return/risk estimates are more negative than at any point in history, it is important to note what we are not saying. We are not saying that stocks are more overvalued than they have ever been. That distinction belongs to the 2000 market peak. While sensitive measures of new orders and economic activity are falling worldwide, and we believe that corporate profit margins have been held at unsustainable levels only as a result of unsustainable government deficits and low savings rates (which are all related through an accounting identity) this is still far from the worst economy in history. That distinction belongs to the Great Depression. We are also not saying that this is the most cyclically overbought market in history. Those distinctions belong to 1929 and the late-1990’s. Emphatically, we are not saying that investors can look at the worst intermediate-term losses in market history, and expect the next one to be worse -- individual market fluctuations have a modest predictable component and a large random component, and can only hope to estimate the predictable component. Rather, what we observe here is a preponderance of negative indications that we’ve never observed in such uniform agreement.
Despite the uniformity of negative signals we presently observe, I can’t say with certainty that this particular instance will produce negative market outcomes, or that we won’t find ourselves at odds with a speculative, richly valued, overbought, overbullish but still-advancing market. But even setting aside our particular methods, we have a very mature market advance, at a high Shiller P/E, atop nearly every upper Bollinger band (two standard deviations above the 20-period average at daily, weekly, and monthly resolutions), in an environment of lopsided bullishness. All of this should make bells go off for anyone familiar with market history. Of all the investment adages that are being embraced as reasons to accept market risk, somehow the phrase “buy low, sell high” is conspicuously absent. I expect that this will prove to be a crucial error for investors. In all of the present ebullience about quantitative easing with no ex-ante amount (which I’ll again point out is far different than “unlimited” QE), the market conditions we observe at present have been consistently associated with negative outcomes throughout history.
Overvalued, Overbought, Overbullish
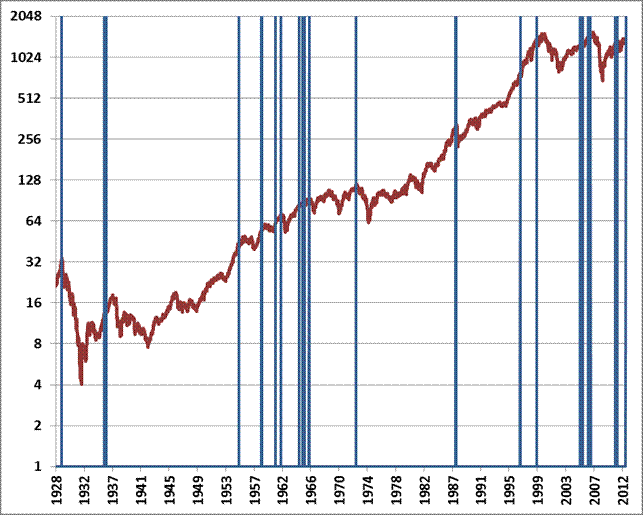
The chart below shows the S&P 500 since 1928, with blue bars identifying points where, 1) the Shiller P/E exceeded 18; 2) the S&P 500 was above its upper Bollinger bands on daily, weekly and monthly resolutions; 3) the percentage of advisory bulls exceeded 45%, with bears less than 27% (sentiment data prior to 1960 is imputed based on the strong post-war relationship between sentiment and measures of price momentum), and; 4) the 10-year Treasury yield exceeded its average over the prior six-month period. This set of criteria is one of many observationally equivalent ways to define an “overvalued, overbought, overbullish, rising-yields” environment.
As I have emphasized in numerous recent comments, different definitions will capture slightly different instances, but with the notable exception of an instance in 1997 during the internet bubble (which was followed by further gains -- though the S&P 500 was actually lower by 2009), those instances have invariably been biased toward awful subsequent market outcomes, with stocks usually substantially lower even years later. Note that the graph is on log-scale, so large percentage losses -- such as the 1987 crash when the market lost a third of its value -- may look deceptively small. That said, the market losses did not always begin immediately, which is important for investors to keep in mind. This is certainly not the only syndrome of evidence that concerns us, but it demonstrates why we are reluctant to accept market risk here.
Gotta Pay To Play
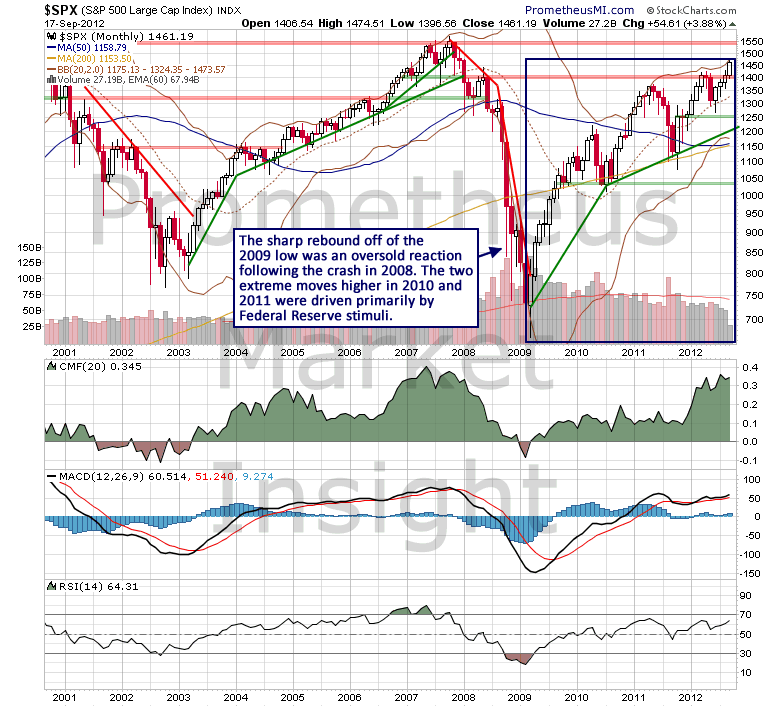
As always, there are no certainties when it comes to financial market forecasting, only possible scenarios and their associated probabilities. However, consistent success is achieved as an investor or trader by aligning yourself with the likely scenarios and protecting yourself from the unlikely ones. It is certainly possible that stocks could rise further during the highly speculative advance from June. However, market risk has increased to a historic extreme, so equally extreme caution is warranted. The gains of the past two years have been fueled by an unprecedented amount of monetary stimuli, so it is highly unlikely that they will be sustained and the next cyclical downtrend, which could begin at any time, will almost certainly erase a substantial portion of the bull market advance from 2009.
Which stock should you buy in your very next trade?
AI computing powers are changing the stock market. Investing.com's ProPicks AI includes dozens of winning stock portfolios chosen by our advanced AI.
Year to date, 2 out of 3 global portfolios are beating their benchmark indexes, with 88% in the green. Our flagship Tech Titans strategy doubled the S&P 500 within 18 months, including notable winners like Super Micro Computer (+185%) and AppLovin (+157%).
Which stock will be the next to soar?
