Last week’s review of the macro market indicators suggested, as we headed back to a full week after the holidays that Gold (GLD) looked to continue lower in the short term uptrend while Crude Oil (USO) marched higher. The US Dollar Index (UUP) was biased higher in the long consolidation while US Treasuries (TLT) were poised to continue lower. The Shanghai Composite (SSEC) looked to continue higher while Emerging Markets (EEM) joined it after a strong reversal. Volatility (VIX) looked to remain subdued keeping the bias higher for the equity index ETF’s SPY, IWM and QQQ. The charts themselves showed that the QQQ was very strong, looking for new highs while the IWM was next and the SPY the weakest of the bunch.
The week played out with Gold drifting and then flooding lower while Crude Oil consolidated in a higher range. The US Dollar reversed moving lower while Treasuries consolidated at the lows. The Shanghai Composite met some resistance and pulled back at the end of the week while Emerging Markets consolidated their recent gains. Volatility found a bottom and started a new bounce but remained subdued. The Equity Index ETF’s moved back higher with the SPY and IWM trailing the QQQ which made new 13 year highs. What does this mean for the coming week? Lets look at some charts.
SPY Daily, SPY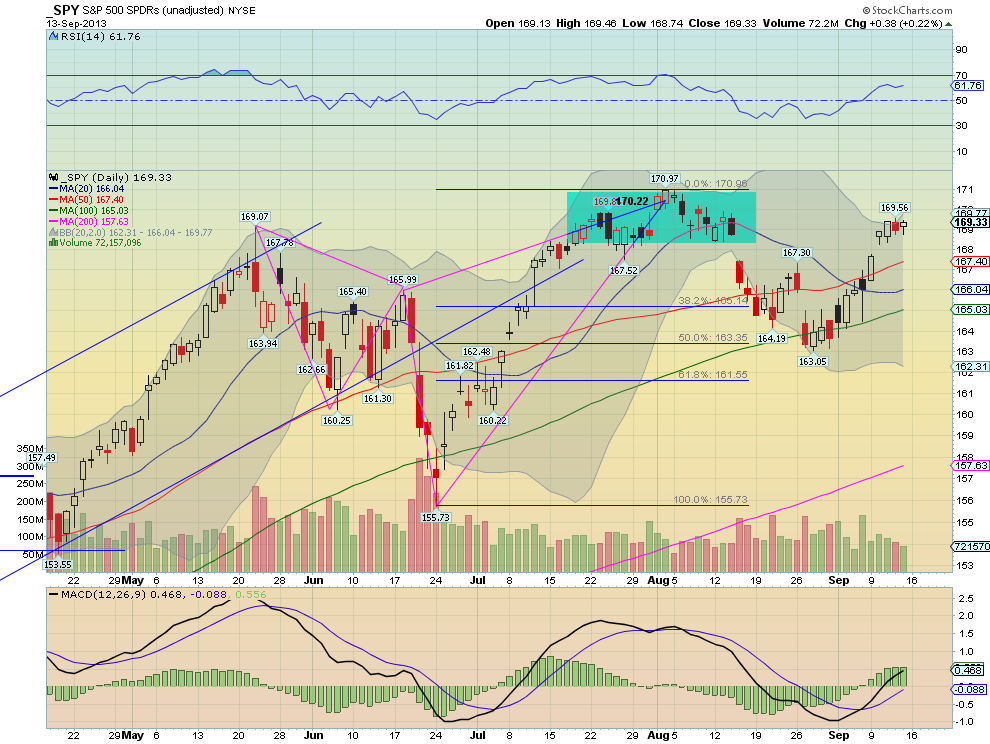
SPY Weekly, SPY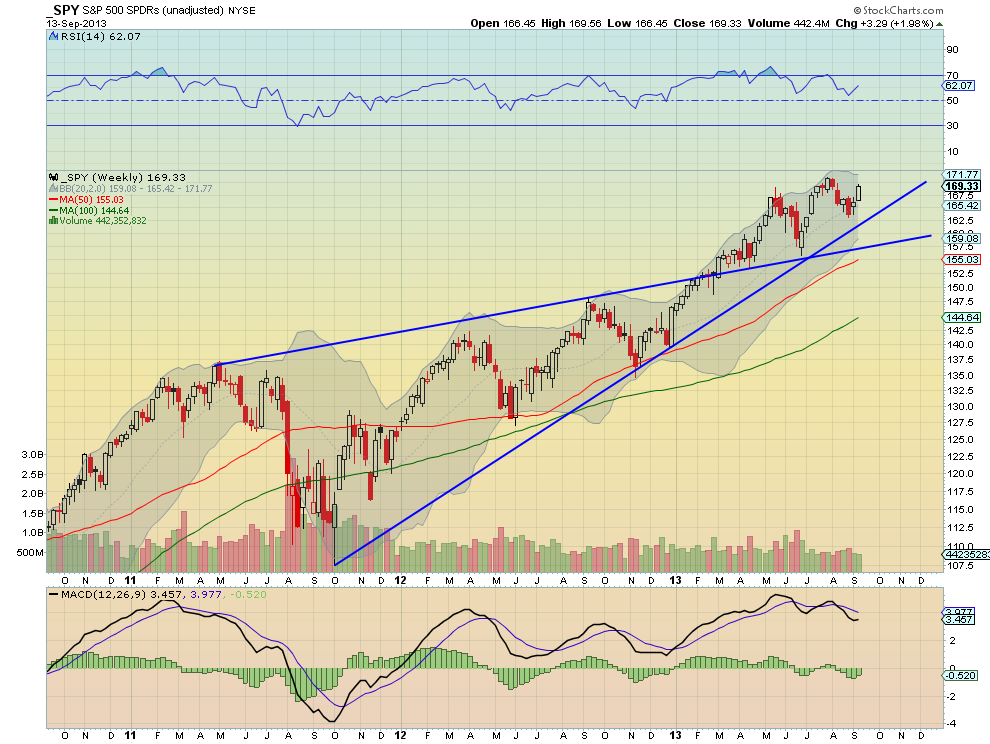
The SPY continued the move from last week higher on Monday and then gapped up and consolidated the rest of the week. The move took it to the top of the Bollinger Bands® but not over and created some separation from the 20 day Simple Moving Average (SMA), but left it short of the all-time high at 170.97 from August 2nd. The Relative Strength index (RSI) is in bullish territory but flattening with a Moving Average Convergence Divergence indicator (MACD) that is rising. These support more upward price action on the daily chart. On the weekly picture the move higher looks much stronger. A strong white candle out of support after a pullback, gunning for a new high. The Measured Move would take it to 178.27. The RSI is bullish and turned higher, which also confirmed a RSI Positive Reversal with the same target as the Measured Move. The MACD could run the table for an upward bias if the MACD line continues to turn up and cross to positive through the signal line. There is resistance at 170.97 and then free air higher. Support comes at 169 and 167.45 followed by 166.50. Mind the open gap, but don’t fear it as it could end up being an Island Reversal higher.
Short Term Consolidation with an Upward Bias.
Heading into September Options Expiration the market is looking stronger again. Look for Gold to continue lower, possibly resuming the downtrend while Crude Oil consolidated in the uptrend. The US Dollar Index looks to continue to the lower end of the broad range while US Treasuries are biased lower but may consolidate. The Shanghai Composite and Emerging Markets both may continue to consolidate in their uptrends with an upward bias. Volatility looks to remain low keeping the bias higher for the equity index ETF’s SPY, IWM and QQQ. Their charts look as if they may consolidate first with the QQQ looking the strongest of the three. Use this information as you prepare for the coming week and trad’em well.
Disclosure: The information in this blog post represents my own opinions and does not contain a recommendation for any particular security or investment. I or my affiliates may hold positions or other interests in securities mentioned in the Blog, please see my Disclaimer page for my full disclaimer.
Original post
- English (UK)
- English (India)
- English (Canada)
- English (Australia)
- English (South Africa)
- English (Philippines)
- English (Nigeria)
- Deutsch
- Español (España)
- Español (México)
- Français
- Italiano
- Nederlands
- Português (Portugal)
- Polski
- Português (Brasil)
- Русский
- Türkçe
- العربية
- Ελληνικά
- Svenska
- Suomi
- עברית
- 日本語
- 한국어
- 简体中文
- 繁體中文
- Bahasa Indonesia
- Bahasa Melayu
- ไทย
- Tiếng Việt
- हिंदी
SPY Trends: Short Term Consolidation With An Upward Bias
Published 09/15/2013, 02:12 AM
SPY Trends: Short Term Consolidation With An Upward Bias
Latest comments
Loading next article…
Install Our App
Risk Disclosure: Trading in financial instruments and/or cryptocurrencies involves high risks including the risk of losing some, or all, of your investment amount, and may not be suitable for all investors. Prices of cryptocurrencies are extremely volatile and may be affected by external factors such as financial, regulatory or political events. Trading on margin increases the financial risks.
Before deciding to trade in financial instrument or cryptocurrencies you should be fully informed of the risks and costs associated with trading the financial markets, carefully consider your investment objectives, level of experience, and risk appetite, and seek professional advice where needed.
Fusion Media would like to remind you that the data contained in this website is not necessarily real-time nor accurate. The data and prices on the website are not necessarily provided by any market or exchange, but may be provided by market makers, and so prices may not be accurate and may differ from the actual price at any given market, meaning prices are indicative and not appropriate for trading purposes. Fusion Media and any provider of the data contained in this website will not accept liability for any loss or damage as a result of your trading, or your reliance on the information contained within this website.
It is prohibited to use, store, reproduce, display, modify, transmit or distribute the data contained in this website without the explicit prior written permission of Fusion Media and/or the data provider. All intellectual property rights are reserved by the providers and/or the exchange providing the data contained in this website.
Fusion Media may be compensated by the advertisers that appear on the website, based on your interaction with the advertisements or advertisers.
© 2007-2025 - Fusion Media Limited. All Rights Reserved.