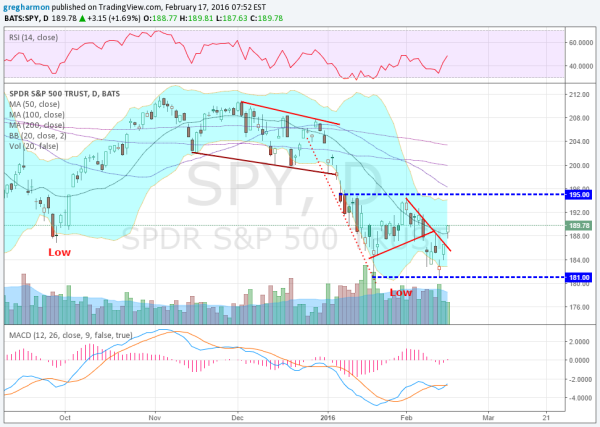
Using the current chart of the S&P 500 ETF (N:SPY) as an example, there are different signals for different horizons. On the short-term timescale, the trader will see a move over the down-trending resistance on Monday, continuing in the pre-market action Tuesday. This is a market to own on this time frame.
But an intermediate-term trader will see something completely different. The SPY held at the prior low but continues in a range between 181 and 195. She might trade the range or step back and determine that the no-man's land between needs to break before an opportunity exists.
A trader on a slightly longer time frame sees a lower-low made against a lower-high in October. This defines a downtrend. The trader may remain short or out of the market until a new low or a higher-high is made. So which trader are you?
Which stock should you buy in your very next trade?
With valuations skyrocketing in 2024, many investors are uneasy putting more money into stocks. Unsure where to invest next? Get access to our proven portfolios and discover high-potential opportunities.
In 2024 alone, ProPicks AI identified 2 stocks that surged over 150%, 4 additional stocks that leaped over 30%, and 3 more that climbed over 25%. That's an impressive track record.
With portfolios tailored for Dow stocks, S&P stocks, Tech stocks, and Mid Cap stocks, you can explore various wealth-building strategies.

