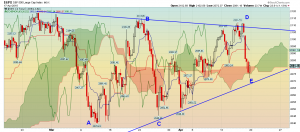
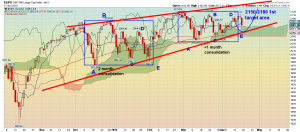
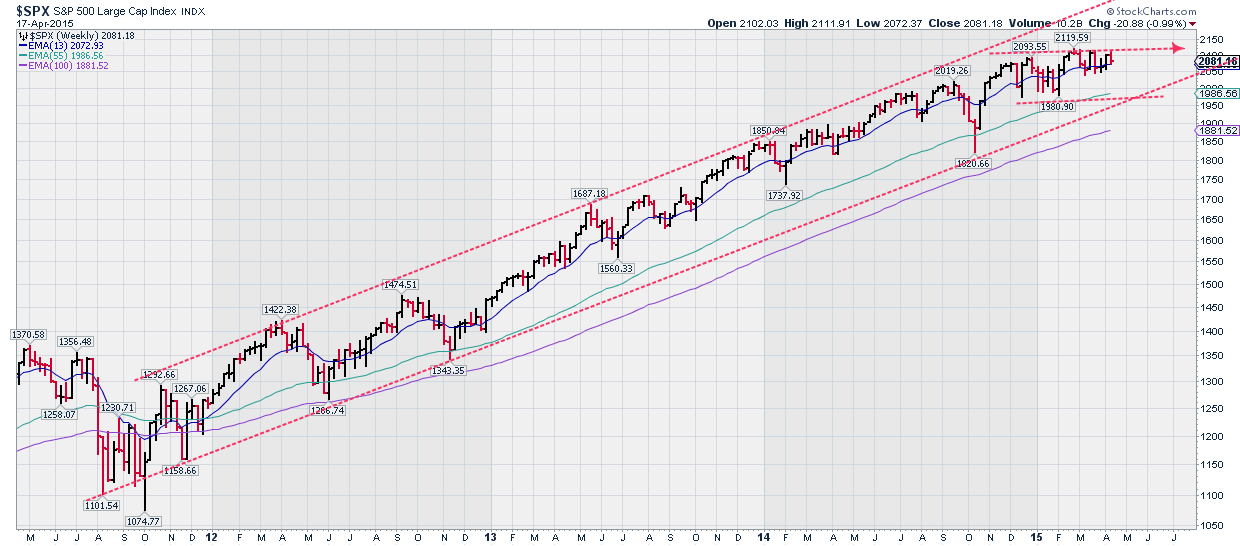
S&P 500 has most probably completed another triangle sideways correction on Friday. Wave E of the triangle was completed at 2072 and I expect a new upward move to start this week. Critical support for this scenario is at 2055-60.

SPX daily charts continue to hold above the Ichimoku cloud support and as long as price is above 2055-60 we should expect a breakout above resistance of 2110-2120. Breaking above that resistance will confirm my bullish view for 2200 target.

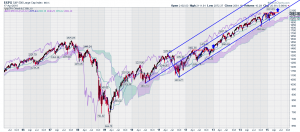
Long-term trend remains bullish. Short- and medium-term trend will change to bearish if we break below 2050 with possible target of 1970 where I believe support will hold. Worst case scenario is we make now a deep correction towards 1970 but I prefer the bullish scenario where we break above the triangle consolidation we are in.


Disclaimer: None of the information or opinions expressed in this blog constitutes a solicitation for the purchase or sale of any security or other instrument. Nothing in this article constitutes investment advice and any recommendations that may be contained herein have not been based upon a consideration of the investment objectives, financial situation or particular needs of any specific recipient. Any purchase or sale activity in any securities or other instrument should be based upon your own analysis and conclusions.
Which stock should you buy in your very next trade?
AI computing powers are changing the stock market. Investing.com's ProPicks AI includes 6 winning stock portfolios chosen by our advanced AI. In 2024 alone, ProPicks AI identified 2 stocks that surged over 150%, 4 additional stocks that leaped over 30%, and 3 more that climbed over 25%. Which stock will be the next to soar?
Unlock ProPicks AI