
S&P is opening today near 1670-73 resistance area. This we believe is a back test of the broken support level at 1670. We believe that downward pressures will come back and push the index lower. We mentioned before that the price zone of 1630-50 is important support area and yesterday we saw prices bounce from the 1646 lows.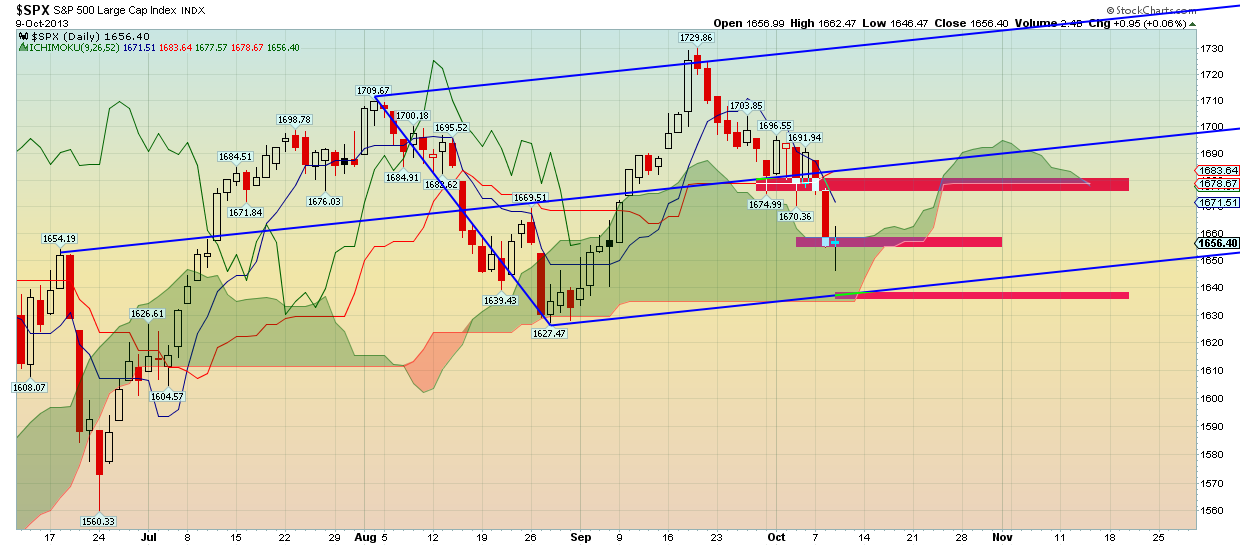
The Ichimoku cloud support was pointed out in previous posts and our view was to take partial profits between 1650-40. However taking into consideration the signals shown in the chart below and the fact that DOW JONES has broken below the August lows makes us believe that the downside pressures are not over yet. The crossing of the two EMA as shown below is another bearish sign that makes us believe that the August low in S&P can be challenged. The upward bounce we believe is just a back test of the broken support at 1670 in the first chart and the back test of the longer term upward sloping yellow dashed trend line.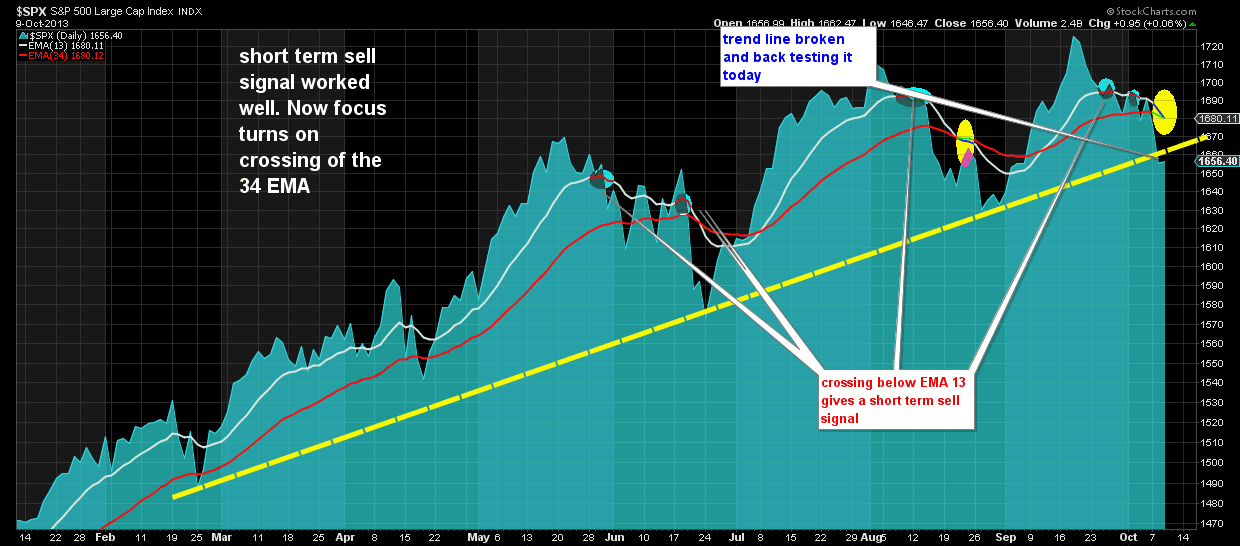
On a weekly level prices are below our signal EMA and there is increased potential of another big drop towards 1600-1620 support. We believe that these selling pressures will come today and continue through Friday. Up to now we have been pretty accurate when selling at 1717-1700-1690-1675 and buying at 1654. We were expecting this week to have increased volatility and to be downward biased. Now we believe that from the beginning of next week we can see a bigger than normal retracement maybe towards 1680-90.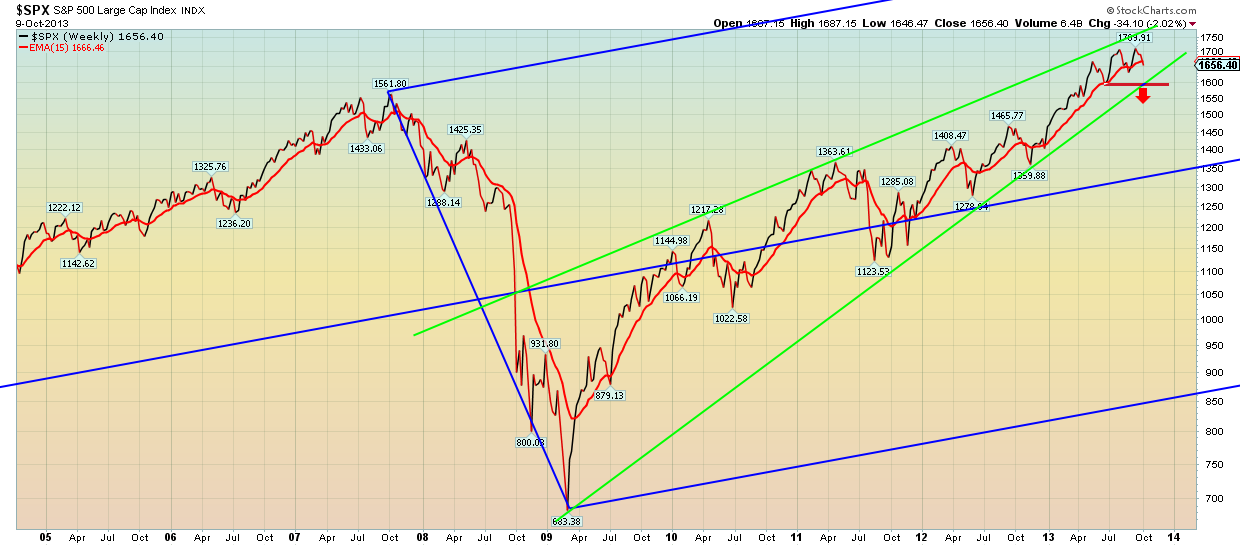
Concluding we are bearish till the end of the week and we target 1630-40 to close short positions opened from higher levels. Breaking above 1680 could challenge out bearish scenario and increase the chances of a strong bounce that could produce new all time highs. For more analysis, comments and a real-time view of my trades become a subscriber today.
Disclosure: None of the information or opinions expressed in this blog constitutes a solicitation for the purchase or sale of any security or other instrument. Nothing in this article constitutes investment advice and any recommendations that may be contained herein have not been based upon a consideration of the investment objectives, financial situation or particular needs of any specific recipient. Any purchase or sale activity in any securities or other instrument should be based upon your own analysis and conclusions.
Which stock should you buy in your very next trade?
AI computing powers are changing the stock market. Investing.com's ProPicks AI includes 6 winning stock portfolios chosen by our advanced AI. In 2024 alone, ProPicks AI identified 2 stocks that surged over 150%, 4 additional stocks that leaped over 30%, and 3 more that climbed over 25%. Which stock will be the next to soar?
Unlock ProPicks AI