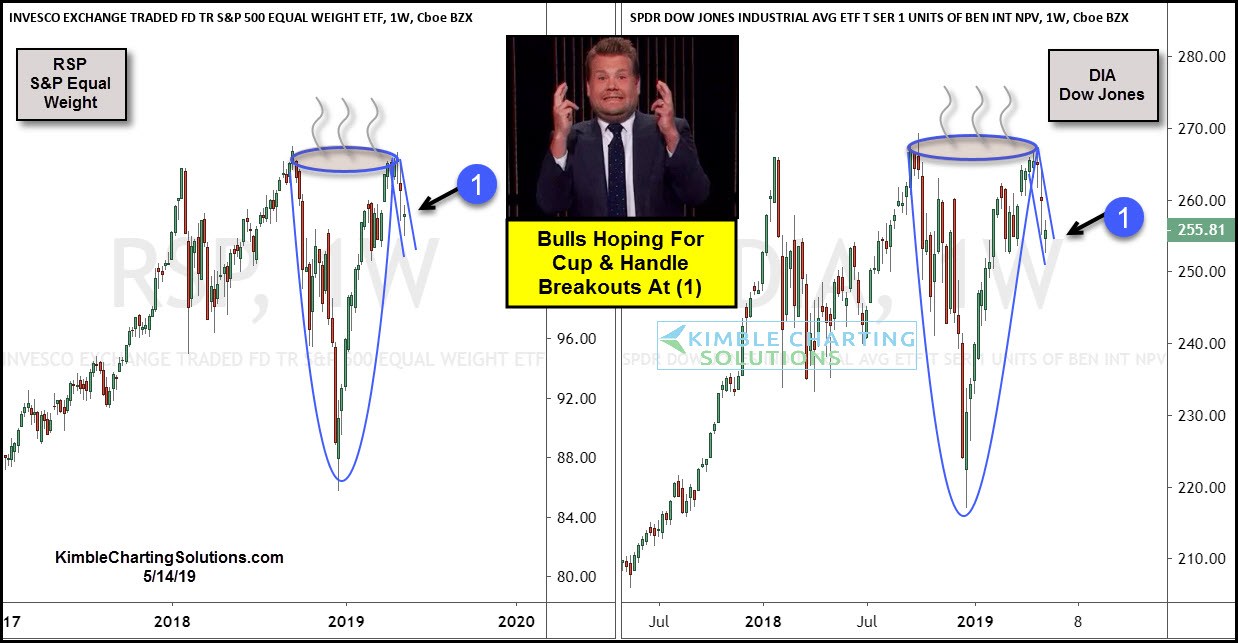
Are the S&P and Dow forming positive “Cup & Handle” patterns over the past 8-months? The bulls sure hope so.
A cup and handle price pattern is a technical indicator that resembles a cup and handle where the cup is in the shape of a “U” and the handle has a slight downward drift. The right-hand side of the pattern typically has low trading volume, and may be as short as seven weeks or as long as 65 weeks, writes James Chen of Investopedia.
Keep this in mind, the Cup & Handle patterns is a bullish continuation pattern.
Two questions come to mind when looking at these patterns. Did a double top take place and will an upside breakout of the handle take place?
Bulls are hoping that an upside breakout of the handle takes place, followed by a breakout above the top of the cup pattern.
What would reduce the odds that this is a bullish pattern? A break below the March lows by both ETF’s.
The price action over the next couple of weeks will tell us a good deal about this pattern.
Which stock should you buy in your very next trade?
AI computing powers are changing the stock market. Investing.com's ProPicks AI includes 6 winning stock portfolios chosen by our advanced AI. In 2024 alone, ProPicks AI identified 2 stocks that surged over 150%, 4 additional stocks that leaped over 30%, and 3 more that climbed over 25%. Which stock will be the next to soar?
Unlock ProPicks AI