BofA warns Fed risks policy mistake with early rate cuts
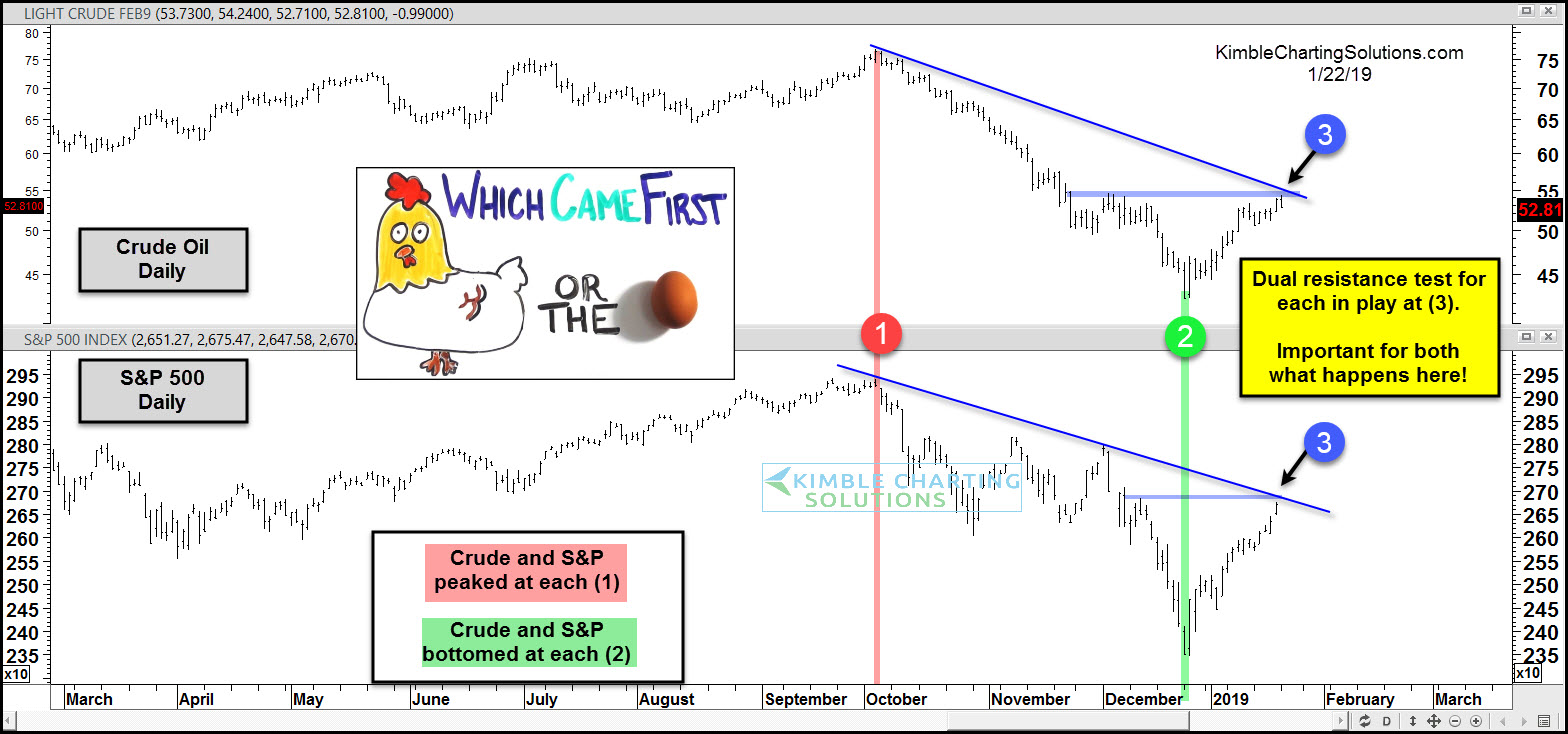
 The correlation between Crude Oil and the S&P 500 has been rather high over the last 100-days, as each looks to have peaked at the same time around the 1st of October at (1).
After peaking together in October, Crude fell over 40% and the S&P nearly declined 20%, with both bottoming on Christmas Eve at each (2).
Both have experienced counter-trend rallies since the lows, as Crude is up 23% and the S&P 13%.
These rallies have both testing dual resistance at each (3), as each has created a series of lower highs over the past 100-days.
Will this resistance hold or will very important counter-trend breakouts take place at (3)? What these two assets do at (3), should go a long way to telling us where they end up at months end and beyond.
Which stocks should you consider in your very next trade?
Successful investors know to check multiple angles before making their move. InvestingPro's three powerful features work together to give you that edge:
ProPicks AI runs 80+ stock-picking strategies, including Tech Titans, which doubled the S&P 500's performance in just 18 months!
Fair Value combines 17 proven valuation models to help you spot overpriced stocks and undervalued gems.
And WarrenAI delivers instant insights on any stock. Ask questions, get vetted answers backed by real-time data (unlike ChatGPT).
Our subscribers use all three to identify stocks before double-digit gains and avoid costly mistakes.
But with 50% during our Summer Sale, even if you only use one of these features the value pays for itself. Sale ends soon—don't wait until prices go back up.
Save 50% while you can