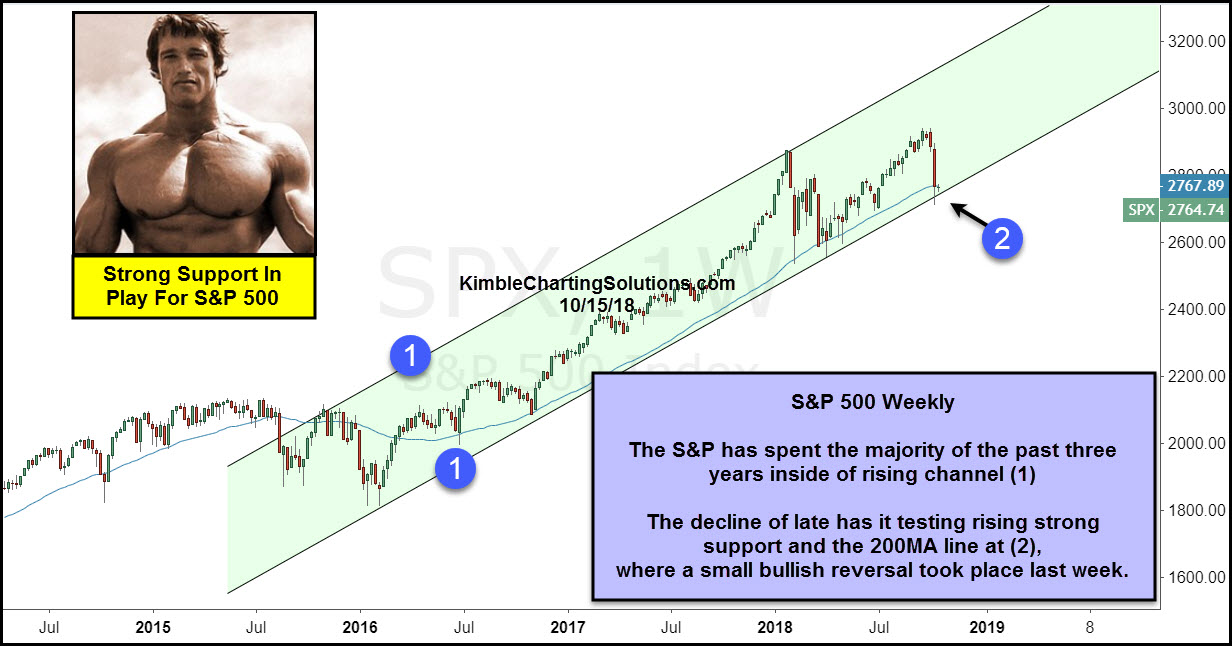
This chart looks at the S&P 500 on a weekly basis over the past couple of years. Since the start of 2016, the S&P has spent a majority of the time inside rising channel (1).
In January, the S&P 500 hit the top of the rising channel and rapid selling followed, taking it down to test rising support in a matter of a couple of weeks.
The recent softness has the S&P facing rising channel support and its 200-day moving average at (2).

The S&P 500’s upward trend remains in play until it breaks below rising channel support and its February lows.
Stay tuned.
Which stock should you buy in your very next trade?
AI computing powers are changing the stock market. Investing.com's ProPicks AI includes 6 winning stock portfolios chosen by our advanced AI. In 2024 alone, ProPicks AI identified 2 stocks that surged over 150%, 4 additional stocks that leaped over 30%, and 3 more that climbed over 25%. Which stock will be the next to soar?
Unlock ProPicks AI