Soft commodities, and corn, wheat and soybean in particular, are all at interesting levels on the daily charts, with all three now approaching transitional areas in terms of both trend and price.
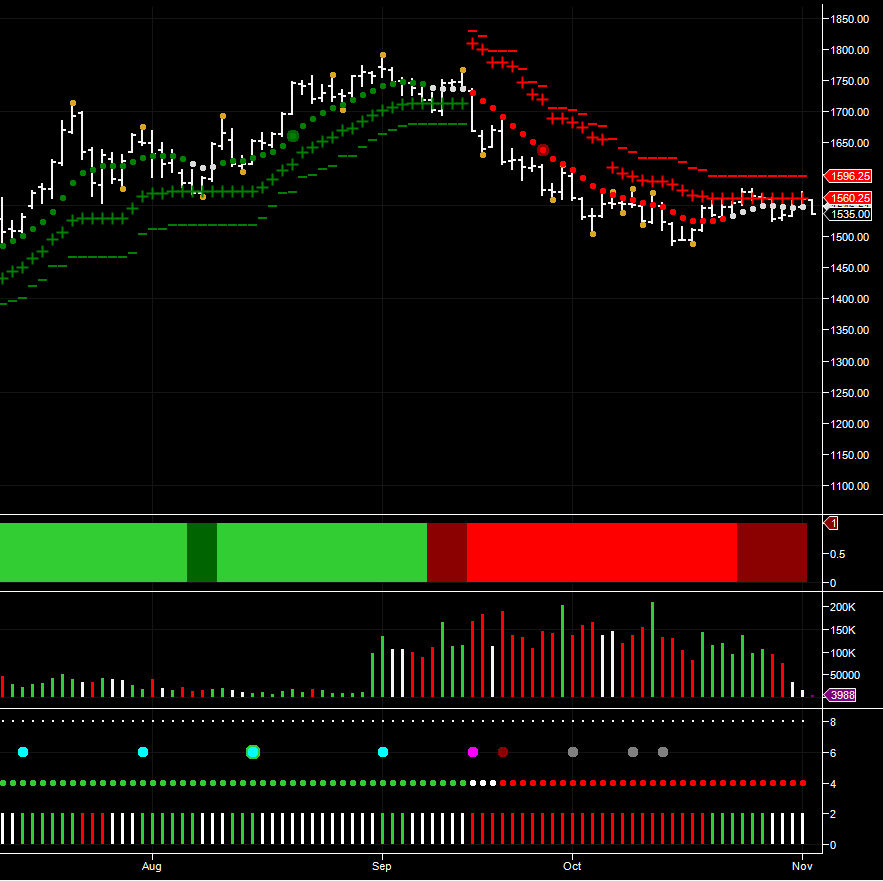
Starting with Soybeans, the commodity extended it’s bullish run throughout the summer and into September, before finally running out of steam in the $1800 per bushel area, finally breaking below the consequent price congestion in mid September, and moving firmly below the key level at $1700 per bushel.
Since then, the commodity have seen sustained selling in the market, finally finding some traction in the $1475 – $1550 region on the daily chart and a testing of resistance in the $1575 per bushel area. However, as we can see, the Hawkeye Heatmap has yet to transition from bearish to bullish, whilst the three day trend remains firmly bullish, and although we have seen buying volume on the three day chart, this has recently reverted to no demand, suggesting that the speculative buyers are now switching their positions to net short for the commodity.

The key for the medium to longer term for Soybeans is the platform of potential support now in place at $1475 per bushel and if this is breached, then expect to see further weakness, with a deeper move to test the $1400 per bushel price point in due course.
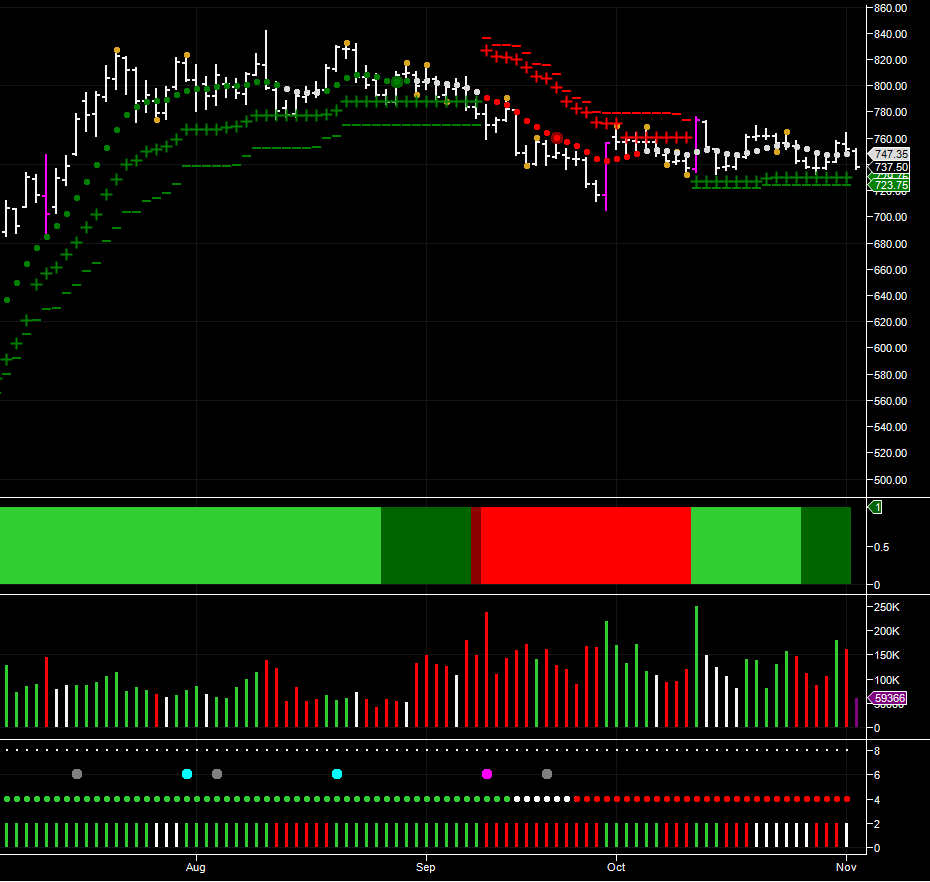
December corn futures are in an equally delicate position, trading in a tight range between $720 per bushel to the downside and $770 to the upside, both of which are clearly defined with the Hawkeye pivots.
The key to the longer term trend for corn is the three day chart, which has remained firmly bearish throughout this extended period of sideways consolidation, and with selling rising selling volumes now appearing on the daily chart, coupled with the recent transition of the Hawkeye Heatmap sentiment now appears to be moving firmly negative, and if the floor of the current price action is breached, then we can expect to see corn futures test the $600 per bushel level, where a deep platform of price support awaits.

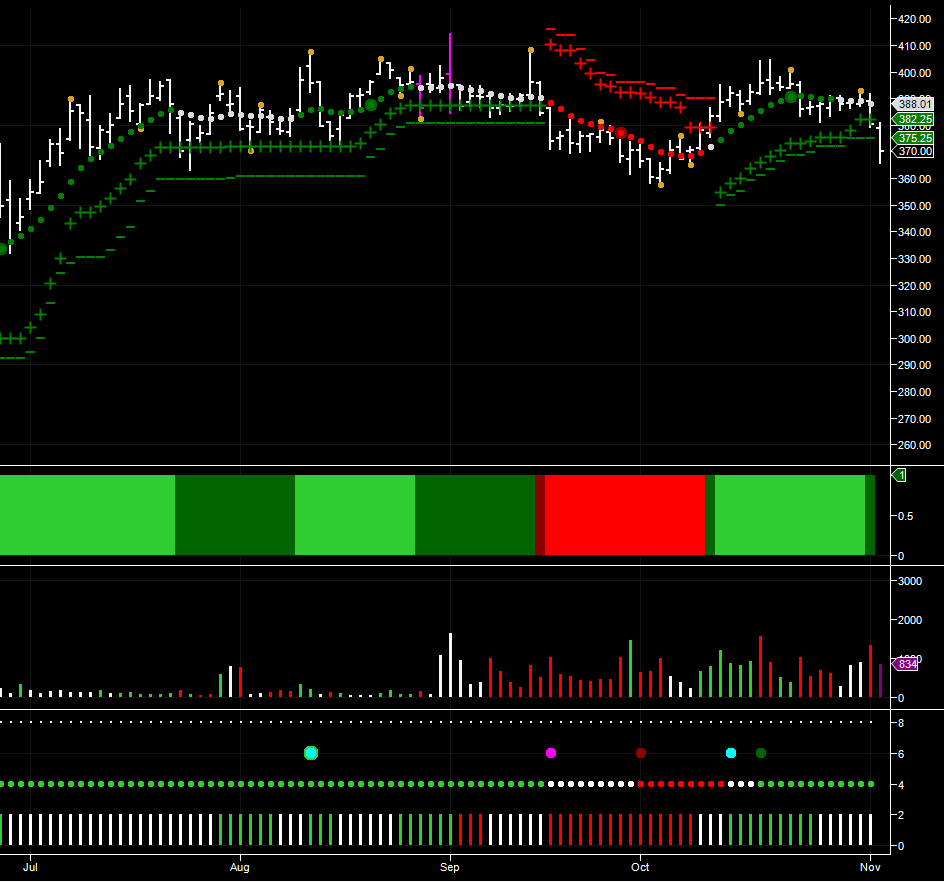
December oats are also looking increasingly bearish, with a Hawkeye isolated pivot high posted earlier in the week, and with an extended area of price resistance now above in the $410 per bushel region, which has been developing since the early summer, the commodity now looks weak. Indeed in today’s trading session we have seen oats move lower to currently trade at $369.50 and breaking below the recent short term support in the $382 area. In addition, the Hawkeye Heatmap is in transition from bullish, and with selling volume on the daily chart yesterday, coupled with no demand volume on the three day chart, the outlook is bearish for oats.
A break and hold below the $355 region will give the commodity a much needed push in this direction and send it lower to test the $270 level of early May in due course.

Starting with Soybeans, the commodity extended it’s bullish run throughout the summer and into September, before finally running out of steam in the $1800 per bushel area, finally breaking below the consequent price congestion in mid September, and moving firmly below the key level at $1700 per bushel.
Since then, the commodity have seen sustained selling in the market, finally finding some traction in the $1475 – $1550 region on the daily chart and a testing of resistance in the $1575 per bushel area. However, as we can see, the Hawkeye Heatmap has yet to transition from bearish to bullish, whilst the three day trend remains firmly bullish, and although we have seen buying volume on the three day chart, this has recently reverted to no demand, suggesting that the speculative buyers are now switching their positions to net short for the commodity.

The key for the medium to longer term for Soybeans is the platform of potential support now in place at $1475 per bushel and if this is breached, then expect to see further weakness, with a deeper move to test the $1400 per bushel price point in due course.
December corn futures are in an equally delicate position, trading in a tight range between $720 per bushel to the downside and $770 to the upside, both of which are clearly defined with the Hawkeye pivots.
3rd party Ad. Not an offer or recommendation by Investing.com. See disclosure here or remove ads.
The key to the longer term trend for corn is the three day chart, which has remained firmly bearish throughout this extended period of sideways consolidation, and with selling rising selling volumes now appearing on the daily chart, coupled with the recent transition of the Hawkeye Heatmap sentiment now appears to be moving firmly negative, and if the floor of the current price action is breached, then we can expect to see corn futures test the $600 per bushel level, where a deep platform of price support awaits.

December oats are also looking increasingly bearish, with a Hawkeye isolated pivot high posted earlier in the week, and with an extended area of price resistance now above in the $410 per bushel region, which has been developing since the early summer, the commodity now looks weak. Indeed in today’s trading session we have seen oats move lower to currently trade at $369.50 and breaking below the recent short term support in the $382 area. In addition, the Hawkeye Heatmap is in transition from bullish, and with selling volume on the daily chart yesterday, coupled with no demand volume on the three day chart, the outlook is bearish for oats.
A break and hold below the $355 region will give the commodity a much needed push in this direction and send it lower to test the $270 level of early May in due course.

Which stock should you buy in your very next trade?
With valuations skyrocketing in 2024, many investors are uneasy putting more money into stocks. Unsure where to invest next? Get access to our proven portfolios and discover high-potential opportunities.
In 2024 alone, ProPicks AI identified 2 stocks that surged over 150%, 4 additional stocks that leaped over 30%, and 3 more that climbed over 25%. That's an impressive track record.
With portfolios tailored for Dow stocks, S&P stocks, Tech stocks, and Mid Cap stocks, you can explore various wealth-building strategies.
