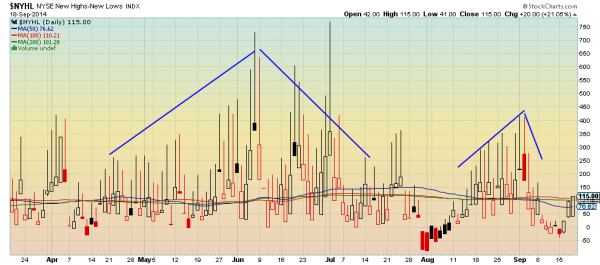
The stock market indexes keep going up. They may seem to be moving as fast as they did in 2009 and 2010. But that is really just because our recency bias. The last few months have been full of rotation and consolidation before a move back higher. This lack of rocket fueled movement higher seems to have a lot of smart traders and investors worried. They look to other indicators to try to get a clue of any change in direction. The problem with that comes right back to that recency bias. Using a common measure of breadth, the NYSE New Highs minus New Lows index is a great place to look to illustrate this.

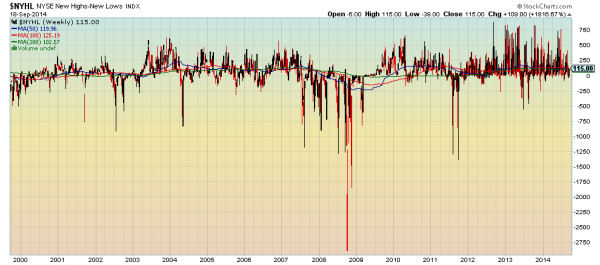
The chart above shows this index for the last 6 months. You can see there was a strong period of positive prints from mid May to late June. But then the strength in the latest push fell short of that strength in both absolute numbers (the peaks) and duration. This is one reason that some are stating that the market looks tired here. But what if you looked at that same index weekly over the last 15 years instead to get a good baseline, like the chart below. 
From this perspective, the area to the right of the spike down in late 2011, corresponding to the last 20% down move in the S&P 500, looks extremely bullish. There has not been a move below -200 since December 2013. Touches below there were commonplace from 2004 through 2007 before things got bad in the market. In fact those more frequent dips to -750 in mid to late 2007 gave you 6 months warning before the crap hit the fan. Breadth does not look anything like that now. So why does the New Highs minus New Lows Index look so scary? Recency. Next time someone hands you a statistic that is designed to scare your money out of the market, make sure you look at in the proper perspective before you act.
The information in this blog post represents my own opinions and does not contain a recommendation for any particular security or investment. I or my affiliates may hold positions or other interests in securities mentioned in the Blog, please see my Disclaimer page for my full disclaimer.
Which stock should you buy in your very next trade?
AI computing powers are changing the stock market. Investing.com's ProPicks AI includes 6 winning stock portfolios chosen by our advanced AI. In 2024 alone, ProPicks AI identified 2 stocks that surged over 150%, 4 additional stocks that leaped over 30%, and 3 more that climbed over 25%. Which stock will be the next to soar?
Unlock ProPicks AI