Bank of Japan keeps interest rates unchanged; outlines ETF sale plans

Silver has been much weaker than Gold over the past 8-years.
Is that trend about to change? Possible!
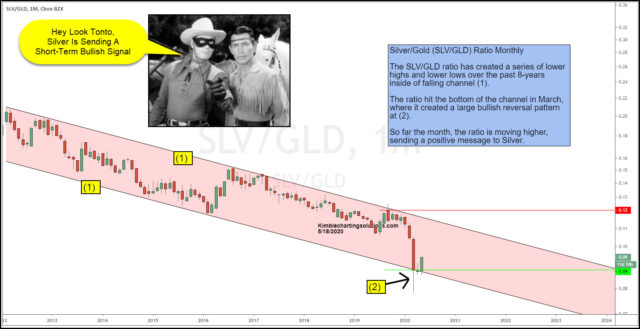
This chart looks at the Silver ETF (NYSE:SLV) and Gold ETF (NYSE:GLD) (SLV/GLD) ratio on a monthly basis over the past 8-years. No doubt the trend for the ratio is lower, as it has created a series of lower highs and lower lows inside of falling channel (1).
While testing the bottom of the 8-year channel in March, the ratio created a rather large bullish reversal pattern at (2).
So far this month the ratio is pushing higher off of the bottom of the channel, which sends a short-term bullish message from the SLV/GLD ratio.
This signal suggests in the short-term that SLV and Silver Miners ETF (NYSE:SIL) should reflect relative strength over Gold for a while.
Which stocks should you consider in your very next trade?
The best opportunities often hide in plain sight—buried among thousands of stocks you'd never have time to research individually.
That's why smart investors use our Stock Screener with 50+ predefined screens and 160+ customizable filters to surface hidden gems instantly.
For example, the Piotroski's Picks method averages 23% annual returns by focusing on financial strength, and you can get it as a standalone screen. Momentum Masters catches stocks gaining serious traction, while Blue-Chip Bargains finds undervalued giants.
With screens for dividends, growth, value, and more, you'll discover opportunities others miss. Our current favorite screen is Under $10/share, which is great for discovering stocks trading under $10 with recent price momentum showing some very impressive returns!

