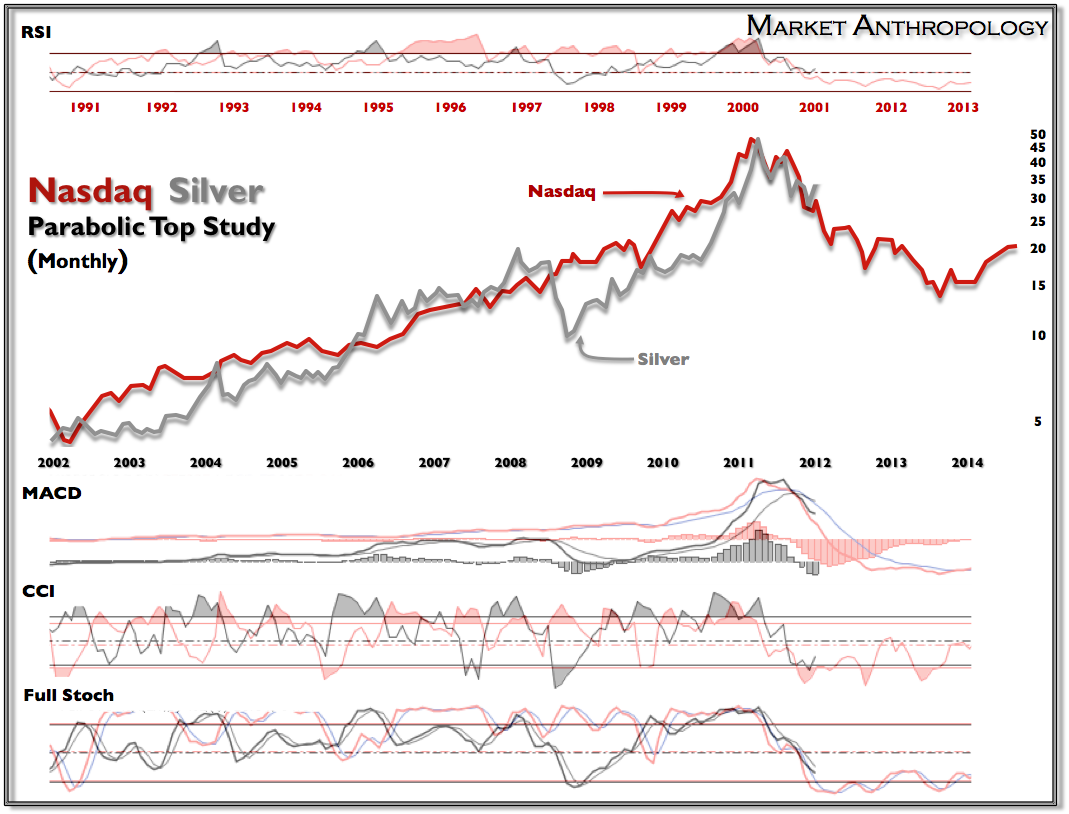
I like to remind myself every now and then why the analogy has worked so well between silver and the Nasdaq market - circa 2000 and now 2001. It's not just the charts that have great similarities - it's the overarching psychology of the boom and bust cycle and the ratio contrasts to their larger sibling (gold & SPX) markets that has provided a long-term roadmap with considerable correlations.
And while the charts certainly represent that emotionality in characteristics such as the parabolic tops, you can find other sentiment and behavioral comparatives in the charts.
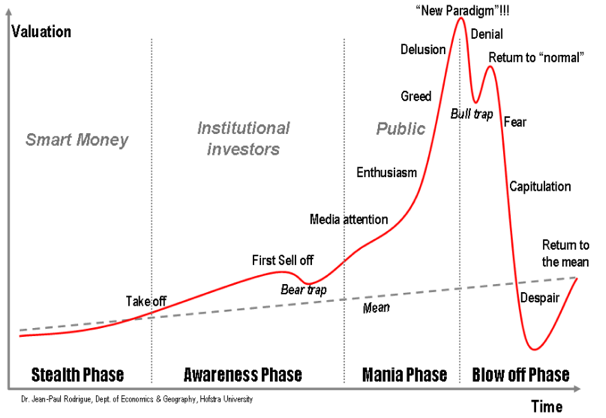
I believe we are currently experiencing a very close parallel to how the Nasdaq traded through the first month of January 2001, after a gut-wrenching performance the previous year.
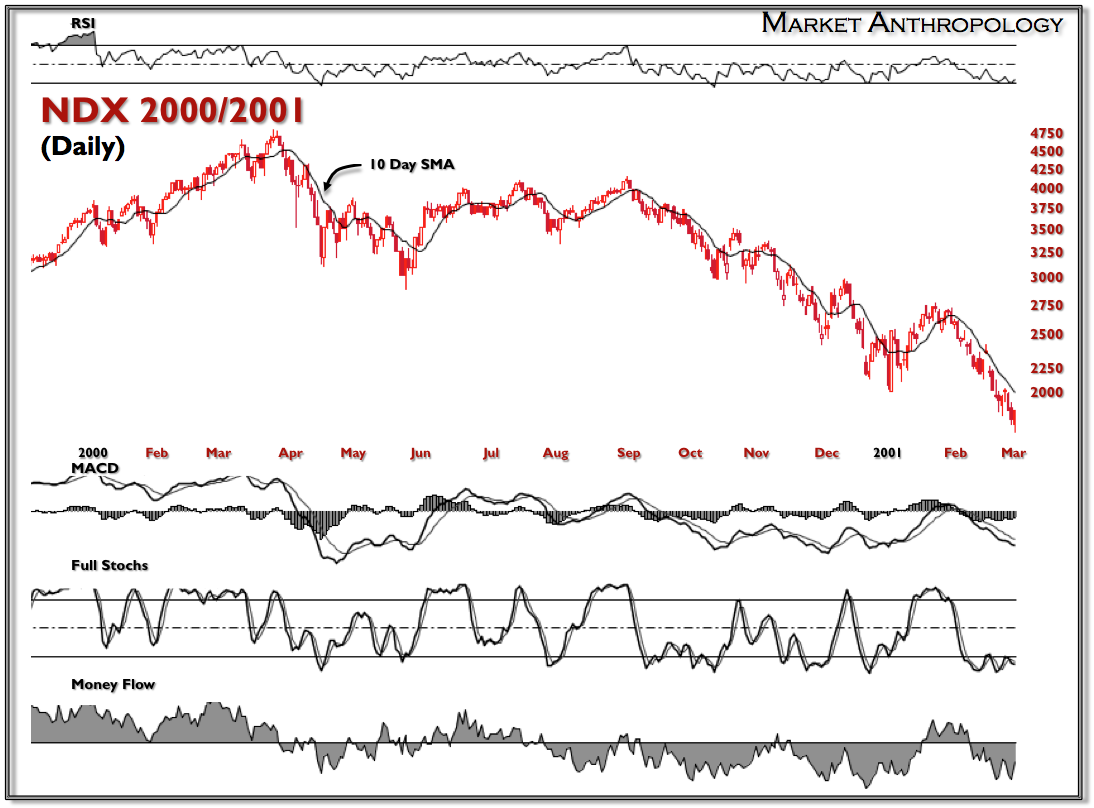
Like silver, it was a slide to the lows for the Nasdaq coming into 2001. A funny thing happened though by simply crossing over into the new year. After a miserable opening session on January 2nd - the Nasdaq went on to rally more than 27% by its third week in January. Traders and Dot-com companies left for dead a few weeks earlier were once again resurrected believers that the correction was over and a return to "normalcy" was upon them.
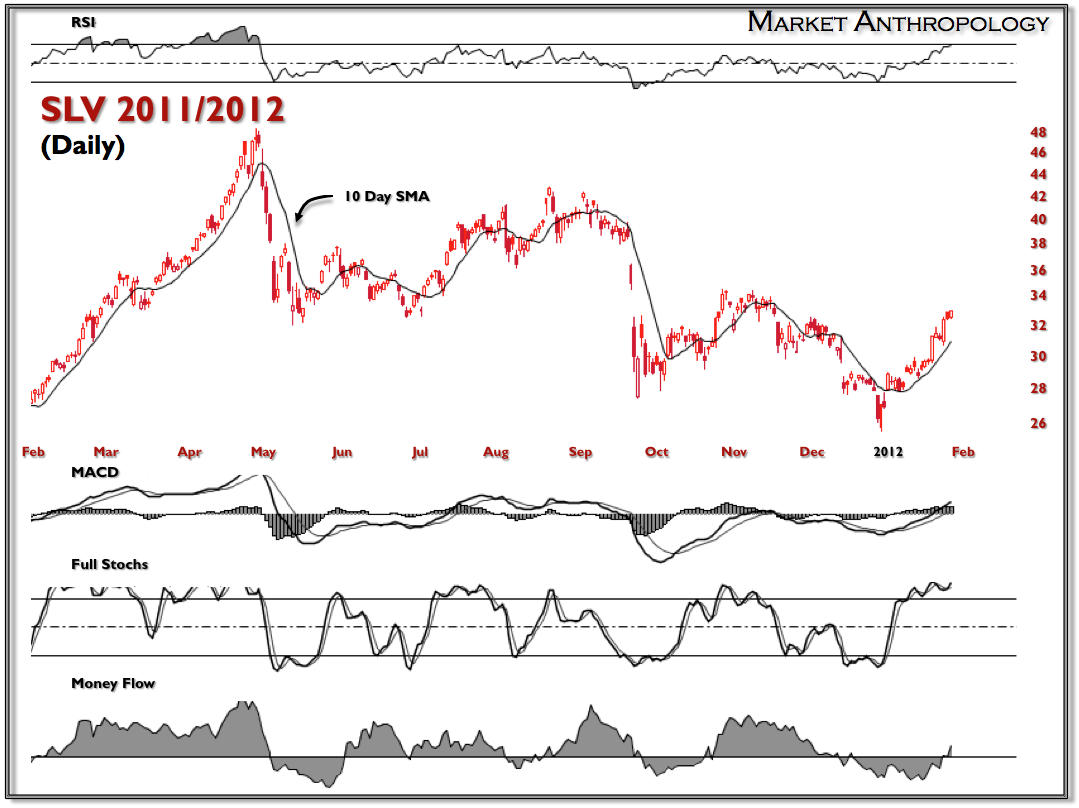
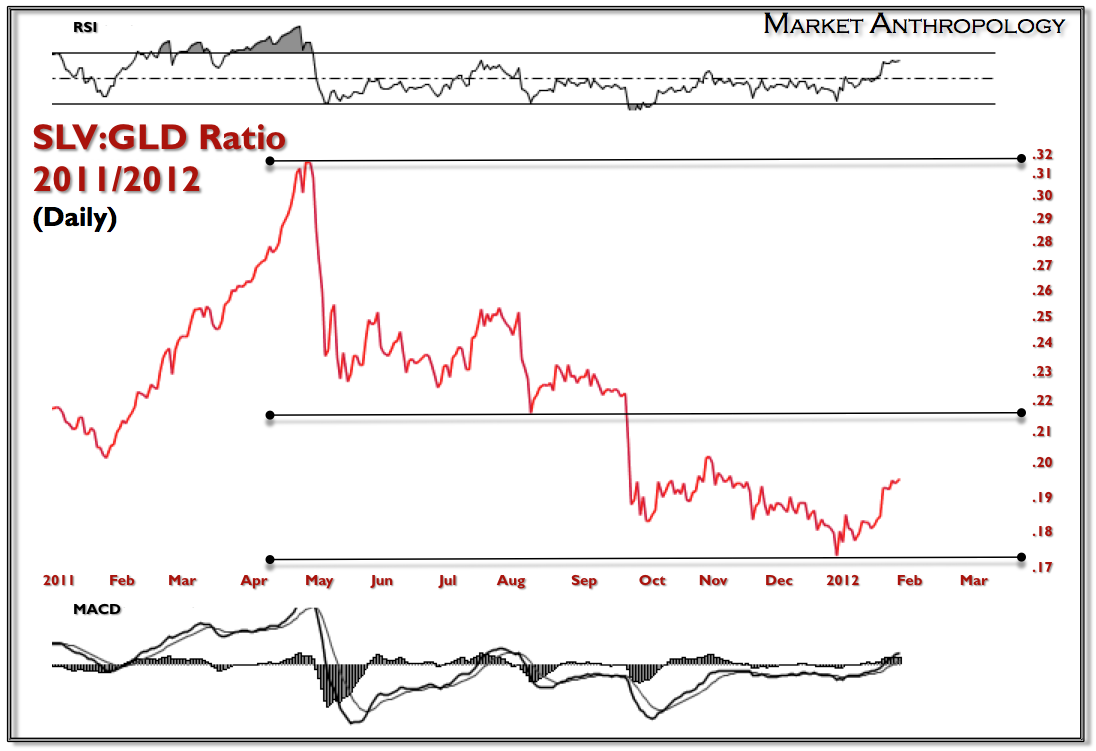
To date, silver has corrected and retraced its losses along very similar pivots to the Nasdaq as expressed in the respective ratio charts.
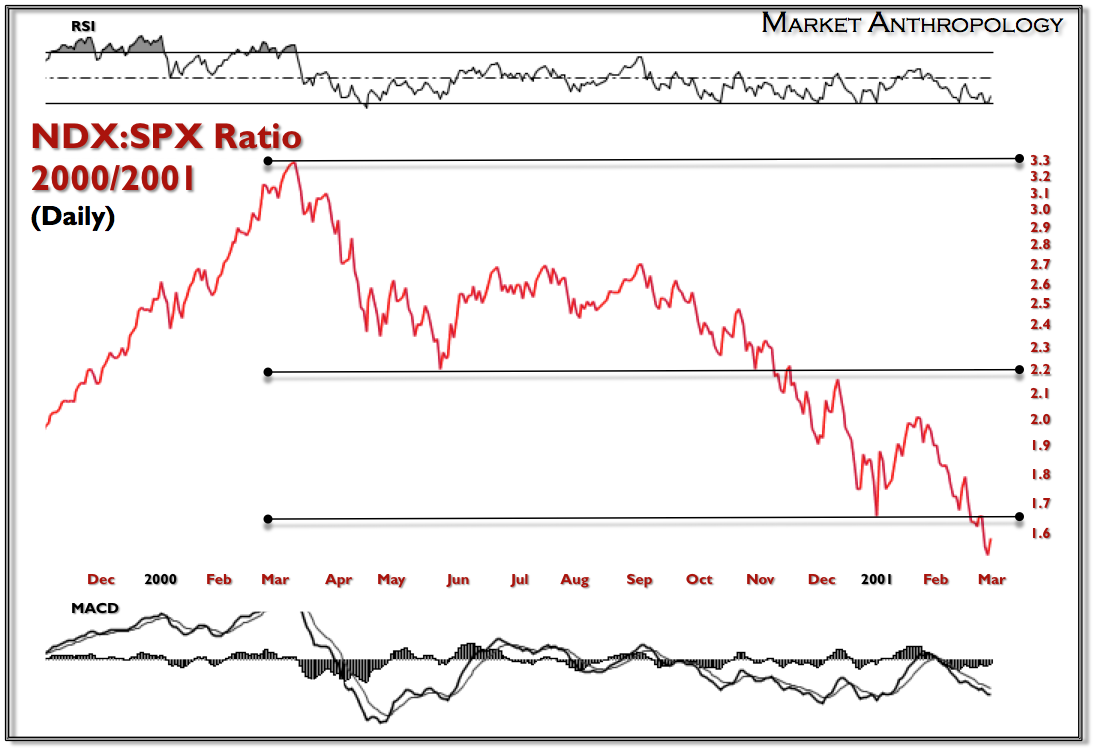
Should the analog continue to prove prescient, February will usher in a return to normalcy, whereas silver strongly underperforms gold. Considering where the equities markets now stand and what this ratio typically implies towards the overall risk appetites for traders, the ephemeral highs now being felt by the impressions and speculation of further easing, will likely give way to another deflationary tide.
And while the charts certainly represent that emotionality in characteristics such as the parabolic tops, you can find other sentiment and behavioral comparatives in the charts.

I believe we are currently experiencing a very close parallel to how the Nasdaq traded through the first month of January 2001, after a gut-wrenching performance the previous year.
Like silver, it was a slide to the lows for the Nasdaq coming into 2001. A funny thing happened though by simply crossing over into the new year. After a miserable opening session on January 2nd - the Nasdaq went on to rally more than 27% by its third week in January. Traders and Dot-com companies left for dead a few weeks earlier were once again resurrected believers that the correction was over and a return to "normalcy" was upon them.


To date, silver has corrected and retraced its losses along very similar pivots to the Nasdaq as expressed in the respective ratio charts.
3rd party Ad. Not an offer or recommendation by Investing.com. See disclosure here or remove ads.

Should the analog continue to prove prescient, February will usher in a return to normalcy, whereas silver strongly underperforms gold. Considering where the equities markets now stand and what this ratio typically implies towards the overall risk appetites for traders, the ephemeral highs now being felt by the impressions and speculation of further easing, will likely give way to another deflationary tide.


Which stock should you buy in your very next trade?
AI computing powers are changing the stock market. Investing.com's ProPicks AI includes 6 winning stock portfolios chosen by our advanced AI. In 2024 alone, ProPicks AI identified 2 stocks that surged over 150%, 4 additional stocks that leaped over 30%, and 3 more that climbed over 25%. Which stock will be the next to soar?
Unlock ProPicks AI