
It is getting tough in this market to decipher what the charts are trying to tell us when it comes to the SharePlanner Reversal Indicator. Primarily because I use both a daily and a weekly version and try to make sense out of both.
So when the two time frames may be giving conflicting messages, the challenge is to figure out what they share in common.
On the daily SPRI, you have a reversal to the upside just getting underway, which may mean that the pullback from the past two days is done and over with.
Here's the daily SPRI: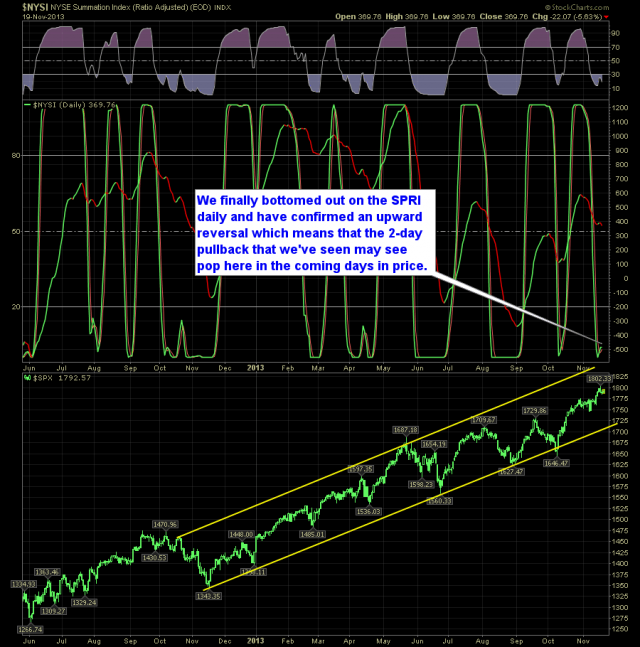
On the weekly chart it is showing that we are halfway through a pullback that has not yet happened. And considering the fact that the Daily SPRI has bottomed, it tells me there is a good chance, the weekly push lower on the SPRI will come and go without any true downside impact to stocks.
Here's the weekly SPRI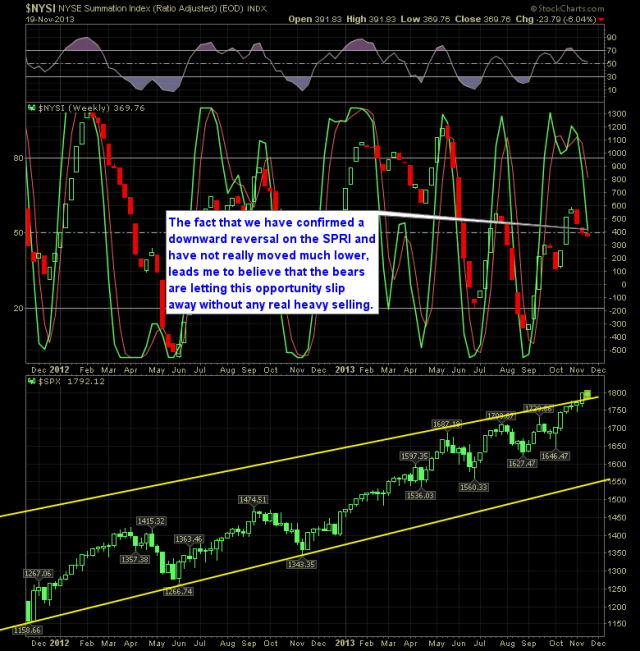
Original post
Which stock should you buy in your very next trade?
AI computing powers are changing the stock market. Investing.com's ProPicks AI includes 6 winning stock portfolios chosen by our advanced AI. In 2024 alone, ProPicks AI identified 2 stocks that surged over 150%, 4 additional stocks that leaped over 30%, and 3 more that climbed over 25%. Which stock will be the next to soar?
Unlock ProPicks AI