The S&P 500 component stocks are divided into nine sectors. All the stocks are used, and each stock is only used once. Those sector indexes are typically tracked using the nine SPDRs, which are essentially ETFs whereby the sectors can be traded. We thought it would be a good idea to take a quick look at charts of those nine sectors.
This article is a bit "chart intensive", but the idea is to demonstrate how you can gather information about a lot of stocks by reviewing their charts. The following charts are taken from one of our chart books.
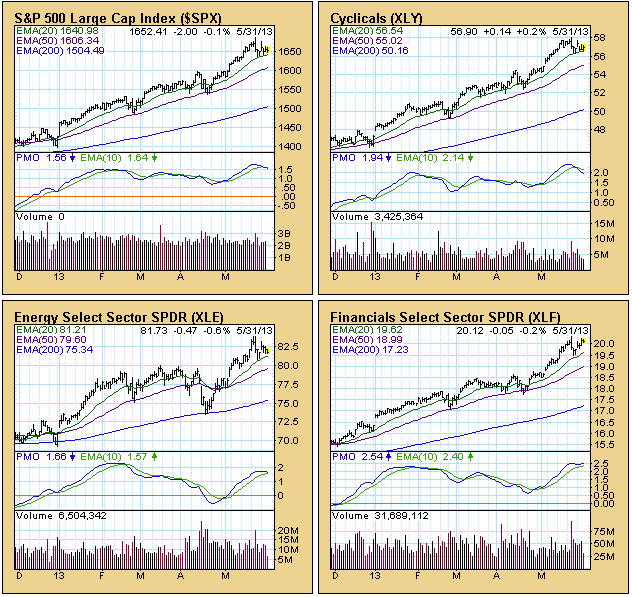
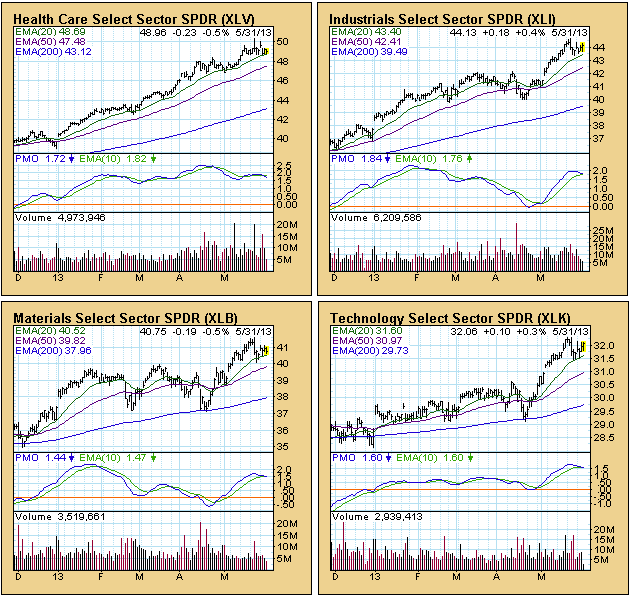
In the first group we begin with the S&P 500 as the benchmark. It has been consolidating in the context of an extended advance. It remains above its 20-EMA, and remains steady. The seven sector charts in the group are similar to their host index in that they are consolidating above their 20-EMA. Some internal weakness is evident in that their PMOs (Price Momentum Oscillators) have topped, and a few of the PMOs have crossed down through their 10-EMAs.


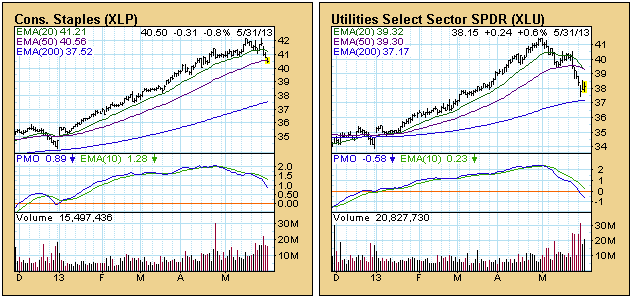
For the two remaining sectors, it is a different story. Consumer Staples has broken down through its 20-EMA and is testing support on its 50-EMA. Utilities is experiencing a serious correction. It has broken through both its 20-EMA and 50-EMA, and appears to be finding support just above its 200-EMA.

Conclusion: The S&P 500 is taking a little break, consolidating its recent advance. The price chart looks solid. Seven of the nine sectors are in similar condition and reflect no serious intermediate-term issues. Only two of the nine sectors are showing price weakness, and only one of those (Utilities) is in bad shape. In short, 78% of the sectors validate S&P 500 price action and do not reflect any serious weakness.
AFTER THE CLOSE UPDATE: So much for writing an article before the market closes. An update is in order. The SPX closed on its low for the day and broke down through its 20-EMA. Consumer Discretionary, Health Care, Energy, and Materials also broke their 20-EMAs. This has happened on most of the charts three other times in the last six months, and is still not a serious technical breach. But it is certainly not a great way to end the week.
This article is a bit "chart intensive", but the idea is to demonstrate how you can gather information about a lot of stocks by reviewing their charts. The following charts are taken from one of our chart books.
In the first group we begin with the S&P 500 as the benchmark. It has been consolidating in the context of an extended advance. It remains above its 20-EMA, and remains steady. The seven sector charts in the group are similar to their host index in that they are consolidating above their 20-EMA. Some internal weakness is evident in that their PMOs (Price Momentum Oscillators) have topped, and a few of the PMOs have crossed down through their 10-EMAs.


For the two remaining sectors, it is a different story. Consumer Staples has broken down through its 20-EMA and is testing support on its 50-EMA. Utilities is experiencing a serious correction. It has broken through both its 20-EMA and 50-EMA, and appears to be finding support just above its 200-EMA.

Conclusion: The S&P 500 is taking a little break, consolidating its recent advance. The price chart looks solid. Seven of the nine sectors are in similar condition and reflect no serious intermediate-term issues. Only two of the nine sectors are showing price weakness, and only one of those (Utilities) is in bad shape. In short, 78% of the sectors validate S&P 500 price action and do not reflect any serious weakness.
3rd party Ad. Not an offer or recommendation by Investing.com. See disclosure here or remove ads.
AFTER THE CLOSE UPDATE: So much for writing an article before the market closes. An update is in order. The SPX closed on its low for the day and broke down through its 20-EMA. Consumer Discretionary, Health Care, Energy, and Materials also broke their 20-EMAs. This has happened on most of the charts three other times in the last six months, and is still not a serious technical breach. But it is certainly not a great way to end the week.
Which stock should you buy in your very next trade?
With valuations skyrocketing in 2024, many investors are uneasy putting more money into stocks. Unsure where to invest next? Get access to our proven portfolios and discover high-potential opportunities.
In 2024 alone, ProPicks AI identified 2 stocks that surged over 150%, 4 additional stocks that leaped over 30%, and 3 more that climbed over 25%. That's an impressive track record.
With portfolios tailored for Dow stocks, S&P stocks, Tech stocks, and Mid Cap stocks, you can explore various wealth-building strategies.