Trump announces trade deal with EU following months of negotiations
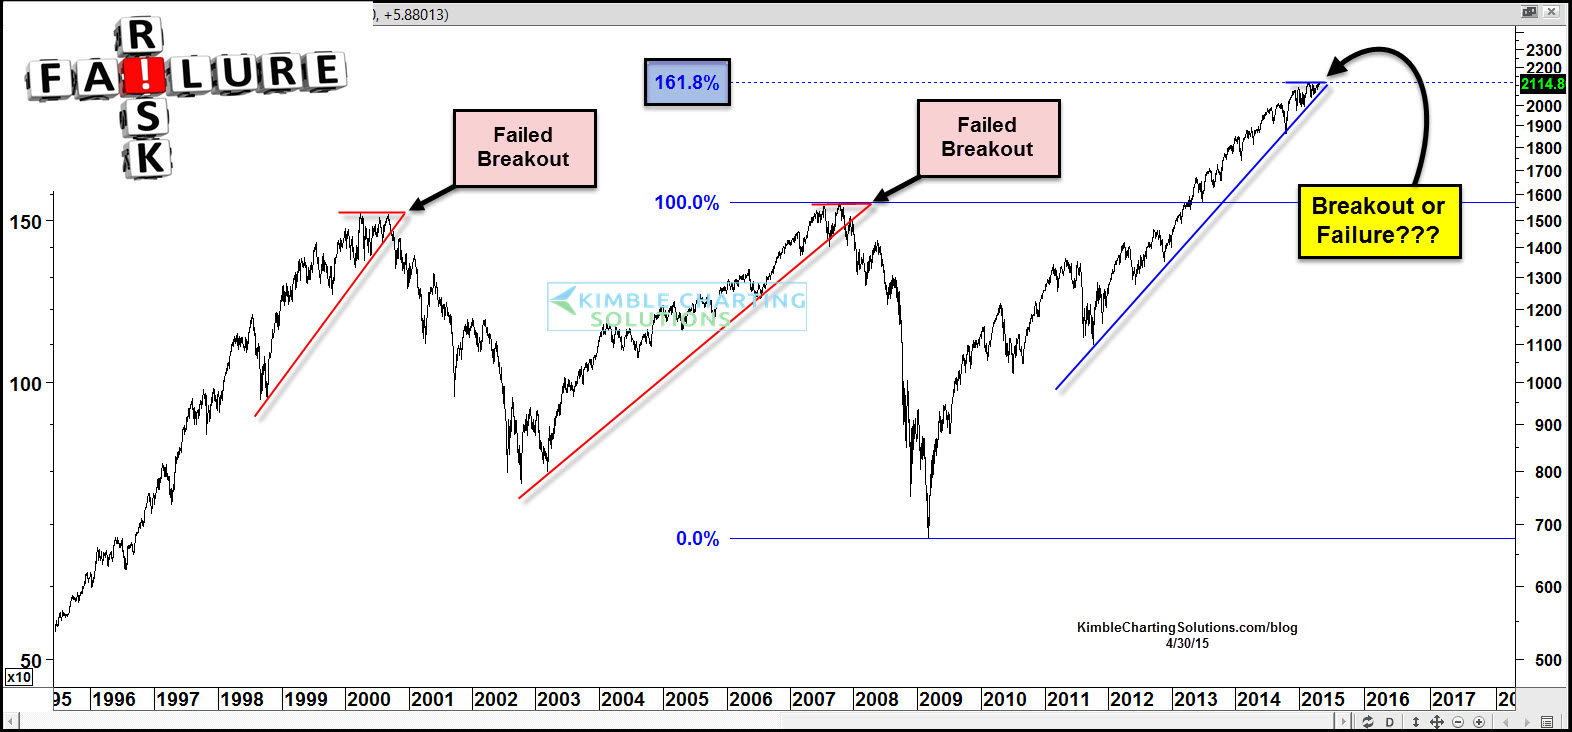
In 2000 and 2007 the S&P 500 created bullish ascending triangle patterns, which two-thirds of the time suggests that higher prices are ahead. The key to this pattern is support holding. Both times multi-year support failed to hold and you know the rest of that story.
Now the S&P 500 appears to be creating the same pattern again -- at 161% Fibonacci extension resistance.
In 2000 and 2007, what the S&P 500 did at support was very important.
In my humble opinion, what the S&P 500 does at support right now is very important too.
Which stock should you buy in your very next trade?
With valuations skyrocketing in 2024, many investors are uneasy putting more money into stocks. Unsure where to invest next? Get access to our proven portfolios and discover high-potential opportunities.
In 2024 alone, ProPicks AI identified 2 stocks that surged over 150%, 4 additional stocks that leaped over 30%, and 3 more that climbed over 25%. That's an impressive track record.
With portfolios tailored for Dow stocks, S&P stocks, Tech stocks, and Mid Cap stocks, you can explore various wealth-building strategies.

