
In our previous post regarding the S&P 500, we explained why we did not want to take part in the post Bernanke rally to 1730 and why we went short from 1717 targeting the 38% Fibonacci retracement at 1688. The index is in a short-term downtrend and I think it is safe to say now that the move from 1627 to 1730 is over and at least we are making a downward correction. This is the positive scenario that we are going to talk about today.
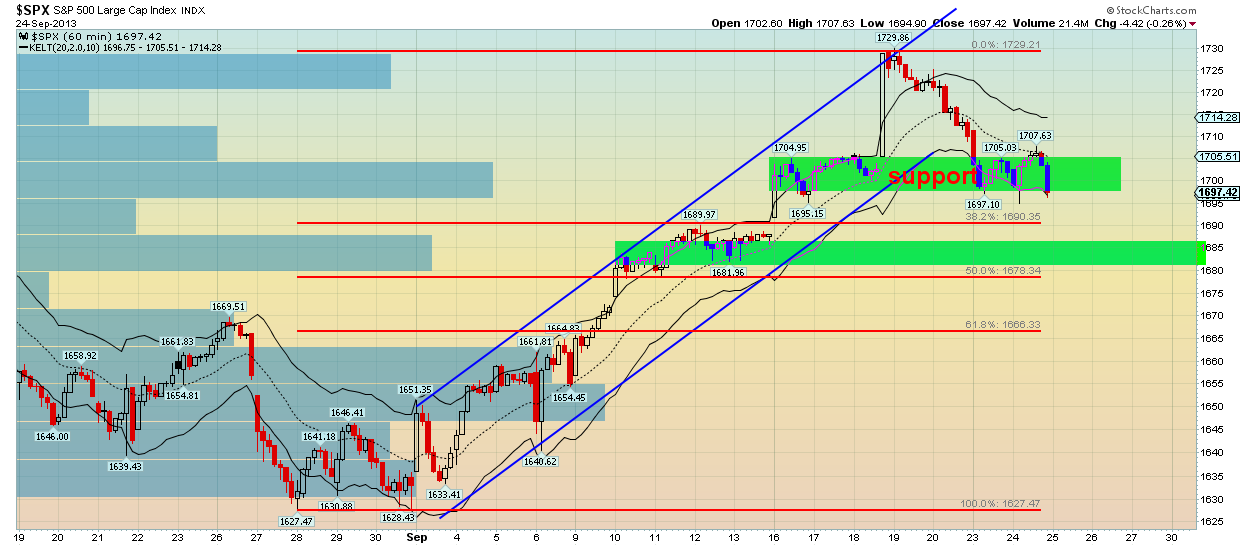
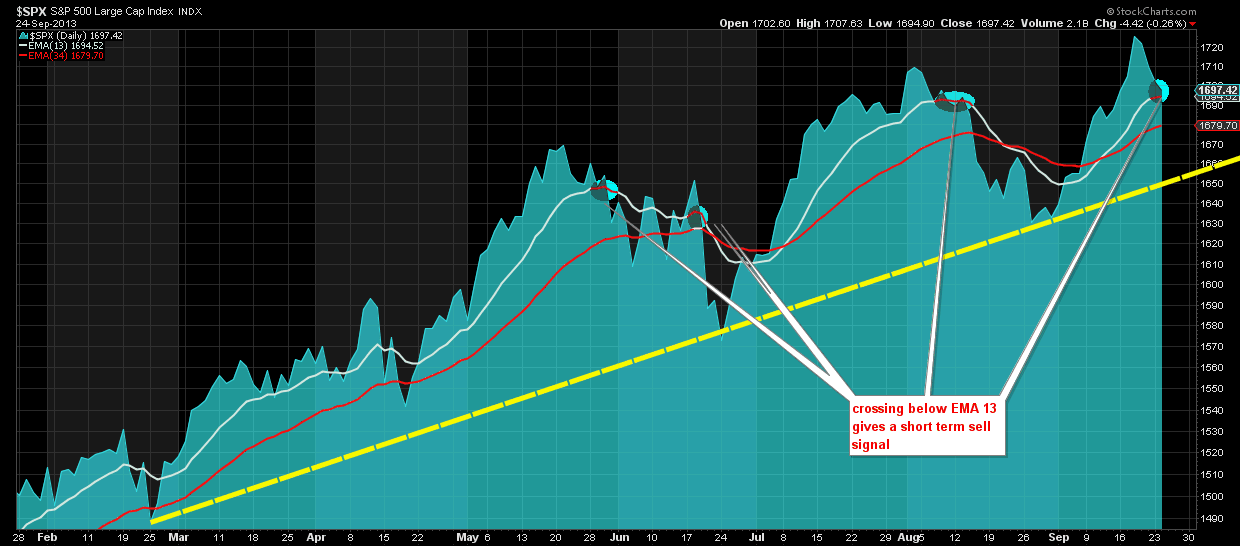
Prices are stalling just above the 38% Fibonacci retracement and with the market having already made an upward three wave move, we now expect prices to make another leg down toward the 61,8% Fibonacci retracement at 1666. Assuming that the downward move from 1730 is wave A to 1697,10 and then followed by wave B to 1707,63, wave C is expected now to move toward 1678 or 1666. Taking into consideration the weekly signals given as shown in the chart below, we think it is more probable to see 1666 if prices cross below the EMA 13 at 1694.
Currently we still believe that prices are expected to decline further at least as part of a short-term correction. There is also the alternative scenario of a longer term top at 1730 that is also taken into account and explained exclusively to our subscribers.
Disclosure: None of the information or opinions expressed in this blog constitutes a solicitation for the purchase or sale of any security or other instrument. Nothing in this article constitutes investment advice and any recommendations that may be contained herein have not been based upon a consideration of the investment objectives, financial situation or particular needs of any specific recipient. Any purchase or sale activity in any securities or other instrument should be based upon your own analysis and conclusions.
3rd party Ad. Not an offer or recommendation by Investing.com. See disclosure here or remove ads.
Which stock should you buy in your very next trade?
AI computing powers are changing the stock market. Investing.com's ProPicks AI includes 6 winning stock portfolios chosen by our advanced AI. In 2024 alone, ProPicks AI identified 2 stocks that surged over 150%, 4 additional stocks that leaped over 30%, and 3 more that climbed over 25%. Which stock will be the next to soar?
Unlock ProPicks AI