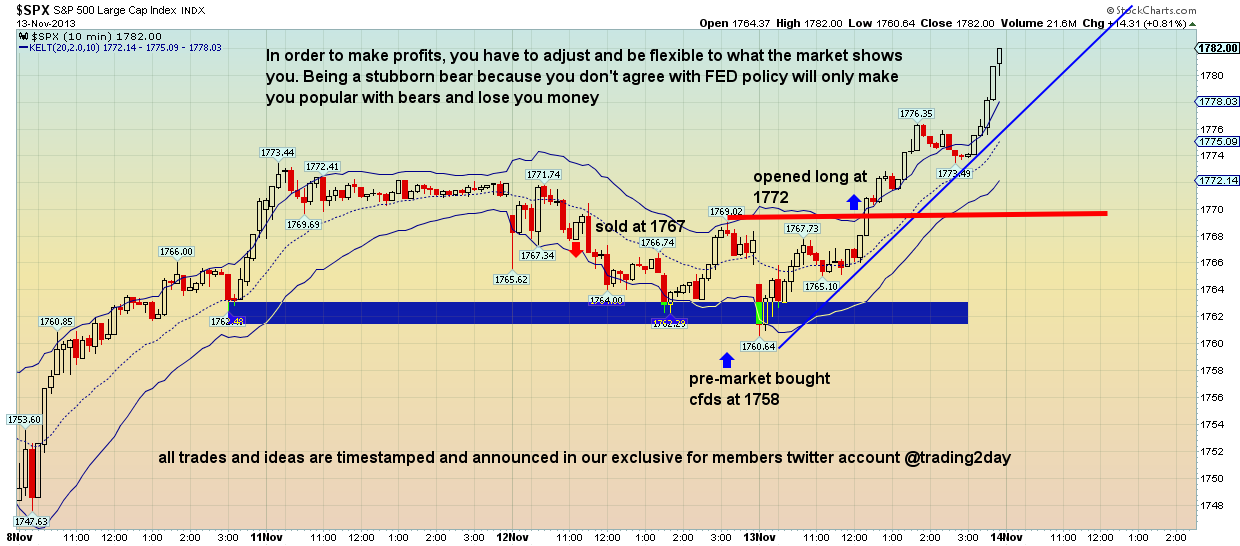
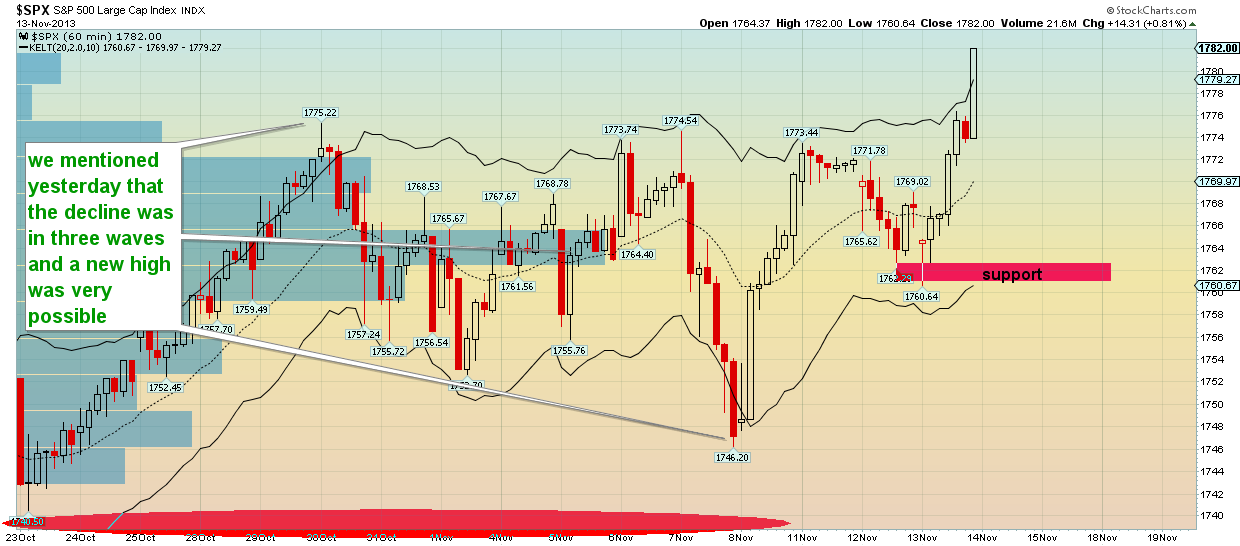
Yesterday we wrote about the possible scenario that the downward correction was not over and that prices could make a downward push towards 1725 where the 38% Fibonacci retracement was. Yesterday we noted that the decline was in three waves from 1775 to 1746 and that this was a corrective decline, implying that the up trend would eventually resume once the correction was over. Our subscribers saw us take a short position in S&P cfds at 1767 as per our analysis. We were expecting prices to break below 1755 support and test the low at 1746. However prices did not make a downward move below 1755 support and as always we adjusted to what the market dictates. Being flexible is important when it comes to making intraday trades and not being stubborn to one side may be the difference between making profitable trades and losing our money. We exited our short position at 1758 (pre-market cfd price) and entered long as we saw resistance level at 1772 break upwards.
Cfd prices are now trading at 1787 and our subscribers received our trades on time as they were executed through our exclusive for members twitter account(our buy stop orders were announced when we closed our short position at 1758). Our flexibility to adjust to market conditions helped us make a profitable trade instead of remaining short like most stubborn bears. The longer term picture may show increased possibility of a big correction towards 1700-1650, but short term trading needs flexibility. Our strategy is transparent as all our trades are time stamped and announced in twitter as they are placed in the market. Prices have broken upwards and it seems that the upward move has more upside potential. Important support level is now the 1756 intermediate low where we bounced from yesterday and made a new higher high. 1790-1800 is now becoming a very plausible target and why not higher if the pattern of higher highs and higher lows continues to unfold.
Disclosure: None of the information or opinions expressed in this blog constitutes a solicitation for the purchase or sale of any security or other instrument. Nothing in this article constitutes investment advice and any recommendations that may be contained herein have not been based upon a consideration of the investment objectives, financial situation or particular needs of any specific recipient. Any purchase or sale activity in any securities or other instrument should be based upon your own analysis and conclusions.
Which stock should you buy in your very next trade?
AI computing powers are changing the stock market. Investing.com's ProPicks AI includes 6 winning stock portfolios chosen by our advanced AI. In 2024 alone, ProPicks AI identified 2 stocks that surged over 150%, 4 additional stocks that leaped over 30%, and 3 more that climbed over 25%. Which stock will be the next to soar?
Unlock ProPicks AI