One of the most consistent calendar effects in the trading world is the so-called Santa Claus rally in global stock markets in the final weeks of December. Historically, equity markets have repeatedly shown a tendency to rally in the final five trading days of the year, and combined with the January effect, which also tends to be positive for equities at the start of a new year, traders have reason for cheer this holiday season.
Thus far, traders have complied with the history books, driving US stocks to new all-time highs with the widely-followed Dow Jones Industrial Average peeking above 18,000 last week and the S&P 500 within striking distance of 2100 as we go to press. As long as there are no big bearish surprises in the next couple of weeks, these calendar-related tailwinds could easily push equities to new highs in early 2015.
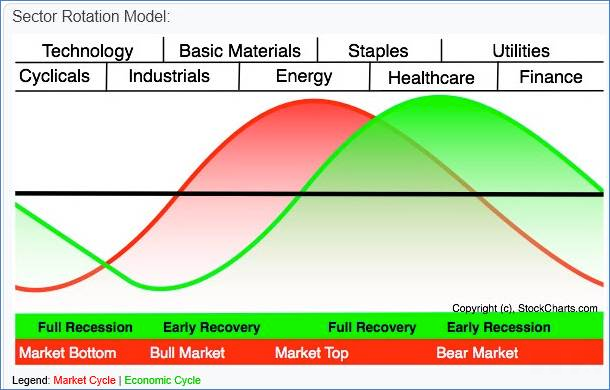
That said, the types of stocks that paced the market in 2014 suggest that the epic stock market rally of the past few years may be growing a bit long in the tooth. Sector rotation is the subset of technical analysis that involves evaluating what types of stocks are performing well to help predict how the stock market as a whole will perform moving forward. Historically, economically-sensitive sectors like consumer cyclical, industrial and energy stocks tend to outperform the stock market in a healthy uptrend, while economically-insensitive sectors like utilities and health care stocks typically outperform when the market is at risk of a pullback.
John Murphy, the godfather of intermarket analysis, developed the idealized sector rotation model shown below:

Source: Stockcharts.com
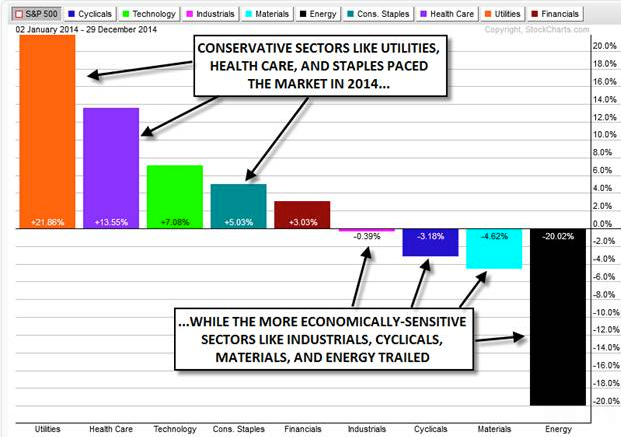
Sector rotation “works” because most fund managers must maintain a full allocation to stocks, regardless of their outlook for future performance. Therefore, the best way for them to mitigate losses in a bear market is to move cash out of high-flying speculative equities and into more conservative, stodgy stocks. Based on this year’s sector performance, money managers have shown a clear preference for safety over capital gains:

Source: Stockcharts.com & FOREX.com
The chart above shows the relative performance of each major sector against the S&P 500 index. This year, three of the four top-performing sectors correspond to the “Market Top” stage of Murphy’s idealized sector rotation model. Likewise, the four worst-performing sectors are all sensitive to economic growth, hinting at a possible end to the “Bull Market” stage. S&P 500 bulls will want to see a rotation back into the traditional “offensive” sectors early this year if the rally is to build on its six-year rally.
Of course, sector rotation is just one way of looking the market, and most other forms of technical analysis including breadth, momentum, and most importantly, basic price analysis are pointing higher for bulls (though bullish sentiment is also reaching concerning levels). For now, a strategy of “skeptical participation” in the equity rally is still favored, but this year’s sector performance augurs for more caution if prices start to break down in 2015, instead of the blind “buy the dip” mentality that was so effective throughout this year.
For more intraday analysis and market updates, follow us on twitter (@MWellerFX and @FOREXcom).
Which stock should you buy in your very next trade?
AI computing powers are changing the stock market. Investing.com's ProPicks AI includes 6 winning stock portfolios chosen by our advanced AI. In 2024 alone, ProPicks AI identified 2 stocks that surged over 150%, 4 additional stocks that leaped over 30%, and 3 more that climbed over 25%. Which stock will be the next to soar?
Unlock ProPicks AI