With only a few stragglers still left to report, the Q1 earnings season is essentially over, and despite initial fears of an outright decline in earnings, the companies in the S&P 500 managed to squeak out a small gain in income. According to FactSet, “blended” S&P 500 earnings grew by 0.7% in the first quarter, better than the -4.5% decline that traders were anticipating a few months ago. That said, stock market investors are far from popping the champagne bottles: the current 0.7% aggregate earnings growth rate represents the lowest year-over-year growth rate since Q3 2012. Only 71% of companies in the S&P 500 beat their earnings estimates, slightly less than the 5-year average of 73%, and only 45% of companies beat their sales estimates, far below the 5-year average of 58%. In terms of specific sectors, health care was the big winner, with such companies reporting overall earnings growth of 23.3% in Q1 and not surprisingly, energy was the laggard with a -56.6% contraction in earnings.
By now, traders are intimately familiar with the main themes that drove Q1’s weak performance. The combination of slower global growth and the strong US dollar hurt the results of many US multinational firms. Meanwhile, the weakness in oil prices (relative to last year) had an immediate negative impact on the energy space, though the delayed impact of lower energy costs will start filter through to the bottom line moving forward. Beyond earnings, traders have plenty of Greek debt related drama to worry about, as well as concerns about China’s sputtering growth.
Technical View: S&P 500
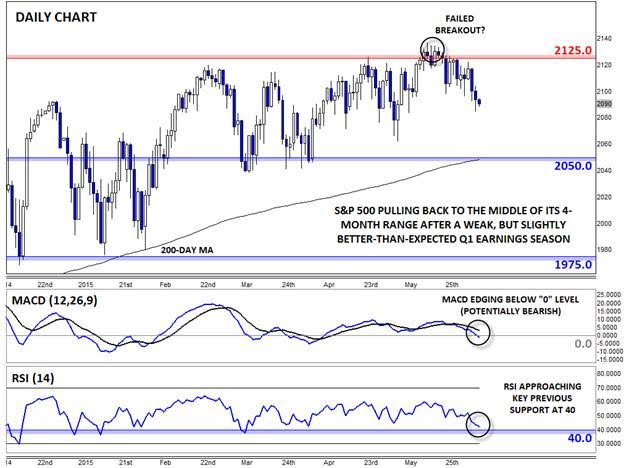
Equity traders are struggling to draw any strong conclusions about the slightly-better-than-expected-but-still-unimpressive Q1 earnings season. The S&P 500 remains rangebound within the 4-month, 75-point range from 2050 up to 2125, notwithstanding the failed breakout attempt in mid-May. Not surprisingly, the secondary indicators are relatively neutral, with the MACD just starting to peek below the 0 level and the RSI indicator nearing previous support at 40; if these indicators start to break their respective support levels, it could foreshadow a breakdown in price itself.
Whether the current consolidation turns out to be a pause in the context of the longer-term uptrend or the beginning of a more significant top remains to be seen, but we’re inclined to give the established long-term uptrend the benefit of the doubt until the market proves us wrong. The 200-day moving average has consistently provided support since back in 2011, so as long as the S&P 500 remains above that key indicator (currently at 2050 and rising), buyers are in control.

Which stock should you buy in your very next trade?
AI computing powers are changing the stock market. Investing.com's ProPicks AI includes 6 winning stock portfolios chosen by our advanced AI. In 2024 alone, ProPicks AI identified 2 stocks that surged over 150%, 4 additional stocks that leaped over 30%, and 3 more that climbed over 25%. Which stock will be the next to soar?
Unlock ProPicks AI