Nvidia, AMD to pay 15% of China chip sales revenue to US govt- FT
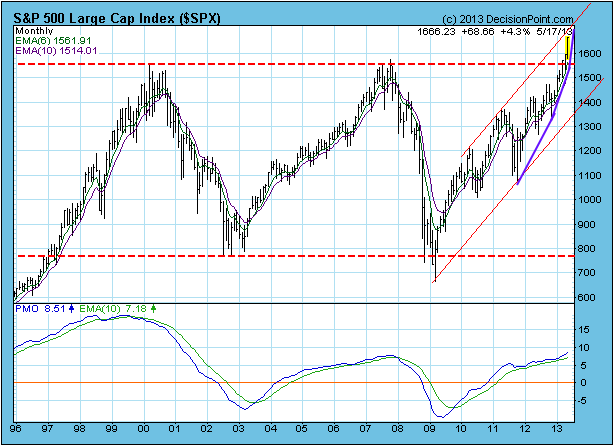
Most obvious is the breakout above the top of a long-term trading range. The breakout is decisive (more than three percent), so the technical assumption is that it is unlikely that prices will fall back below the line of resistance, which is now support.
After a breakout we expect prices to correct back toward the point of breakout. We can see that the index is approaching the top of a rising trend channel, and, when that is reached, it would be a logical time for a correction to begin.

However, we noted earlier this week that a parabolic up move appears to be in progress. On the chart this has been annotated as purple trend lines with ever-increasing angles of ascent. Parabolic moves are signs of mania in the market, and this can cause prices to move higher and faster than would be considered reasonable. These moves can be fun to ride, but it is virtually impossible to know when they will end. When they do end, the reversal is usually abrupt, and the decline breathtaking. The most exaggerated parabolics occur in prices of a single stock or commodity. With an index composed of many stocks, it should be more subdued.
Conclusion: The S&P 500 is in uncharted territory, and the only resistance is the top of the rising trend channel, at which point we would expect a consolidation or correction toward the point of breakout to begin. The long-term breakout implies that prices are going to go higher, and the parabolic nature of the advance implies that it is likely to accelerate.
After a breakout we expect prices to correct back toward the point of breakout. We can see that the index is approaching the top of a rising trend channel, and, when that is reached, it would be a logical time for a correction to begin.

However, we noted earlier this week that a parabolic up move appears to be in progress. On the chart this has been annotated as purple trend lines with ever-increasing angles of ascent. Parabolic moves are signs of mania in the market, and this can cause prices to move higher and faster than would be considered reasonable. These moves can be fun to ride, but it is virtually impossible to know when they will end. When they do end, the reversal is usually abrupt, and the decline breathtaking. The most exaggerated parabolics occur in prices of a single stock or commodity. With an index composed of many stocks, it should be more subdued.
Conclusion: The S&P 500 is in uncharted territory, and the only resistance is the top of the rising trend channel, at which point we would expect a consolidation or correction toward the point of breakout to begin. The long-term breakout implies that prices are going to go higher, and the parabolic nature of the advance implies that it is likely to accelerate.
3rd party Ad. Not an offer or recommendation by Investing.com. See disclosure here or remove ads.
Which stock should you buy in your very next trade?
With valuations skyrocketing in 2024, many investors are uneasy putting more money into stocks. Unsure where to invest next? Get access to our proven portfolios and discover high-potential opportunities.
In 2024 alone, ProPicks AI identified 2 stocks that surged over 150%, 4 additional stocks that leaped over 30%, and 3 more that climbed over 25%. That's an impressive track record.
With portfolios tailored for Dow stocks, S&P stocks, Tech stocks, and Mid Cap stocks, you can explore various wealth-building strategies.