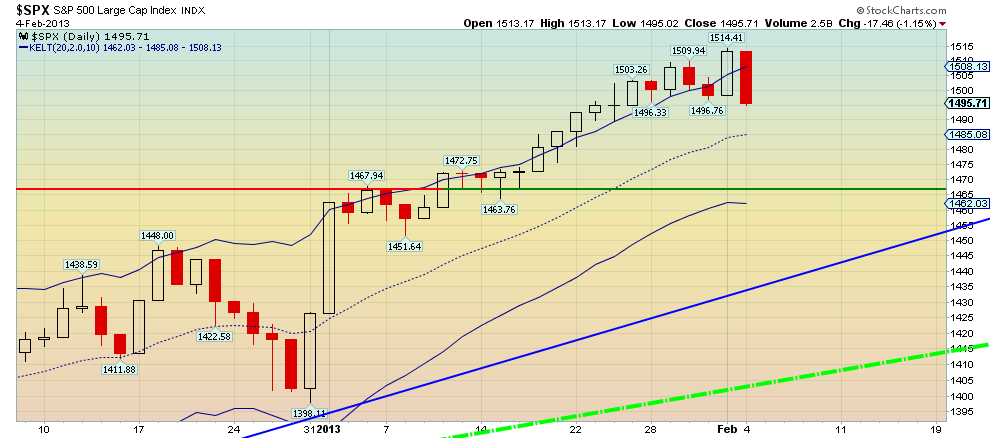
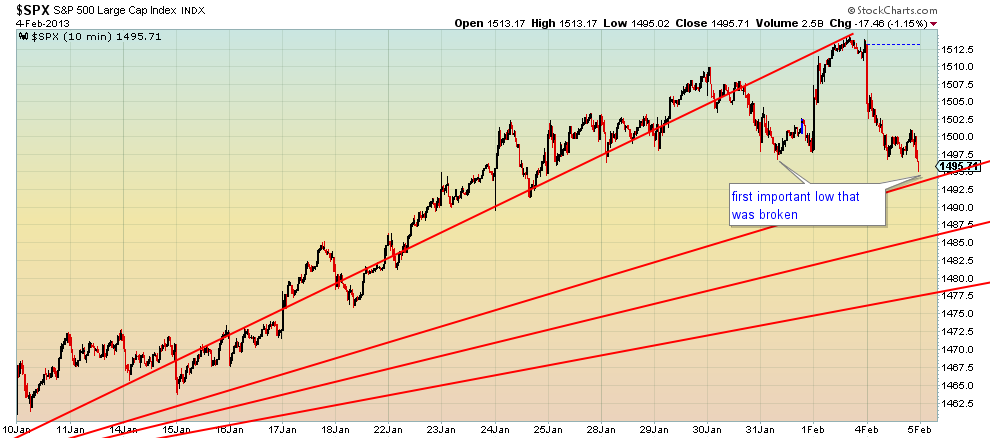
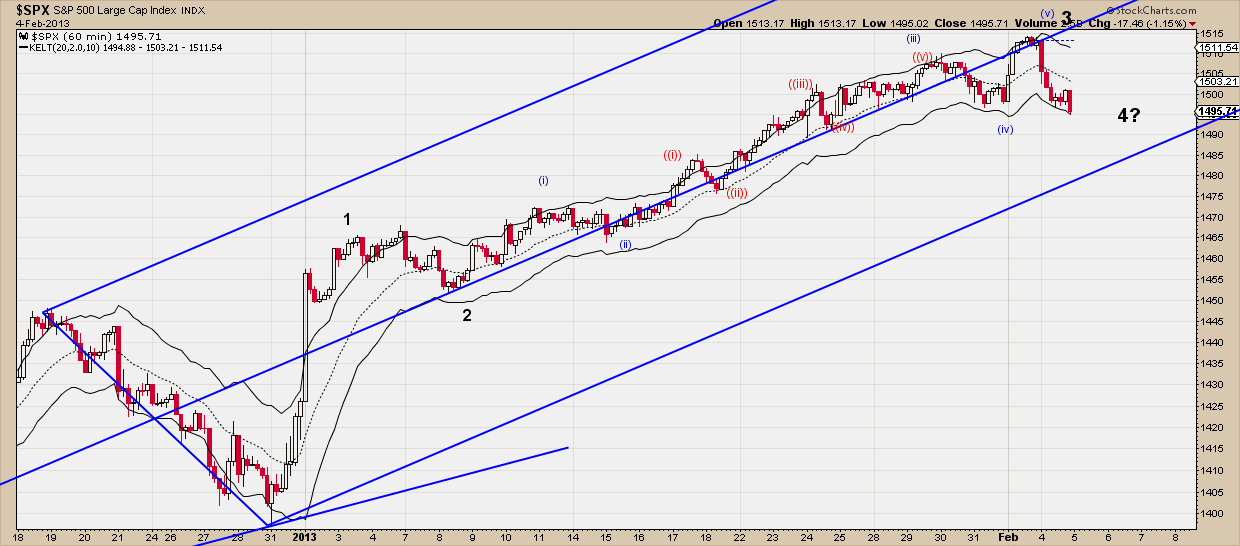
The S&P 500 confirmed the worrying signals we cited yesterday despite the new high at 1514. Last Thursday we first mentioned how cautious bulls should be, because a correction towards 1470 was imminent. On Friday the market was strong and bounced right back up from the support level of 1497.

The breakout towards 1514 that followed gave some hope that the market was re-energised and was heading towards 1520 and why not higher. In our twitter update after Monday’s open we mentioned how crucial was the 1504 support for the bullish view. However the daily candle yesterday was so strong that it took back the whole candle from Friday’s breakout and then some.

The sequence of higher highs and higher lows ended yesterday. The much awaited correction is most probably on route towards 1470-80.

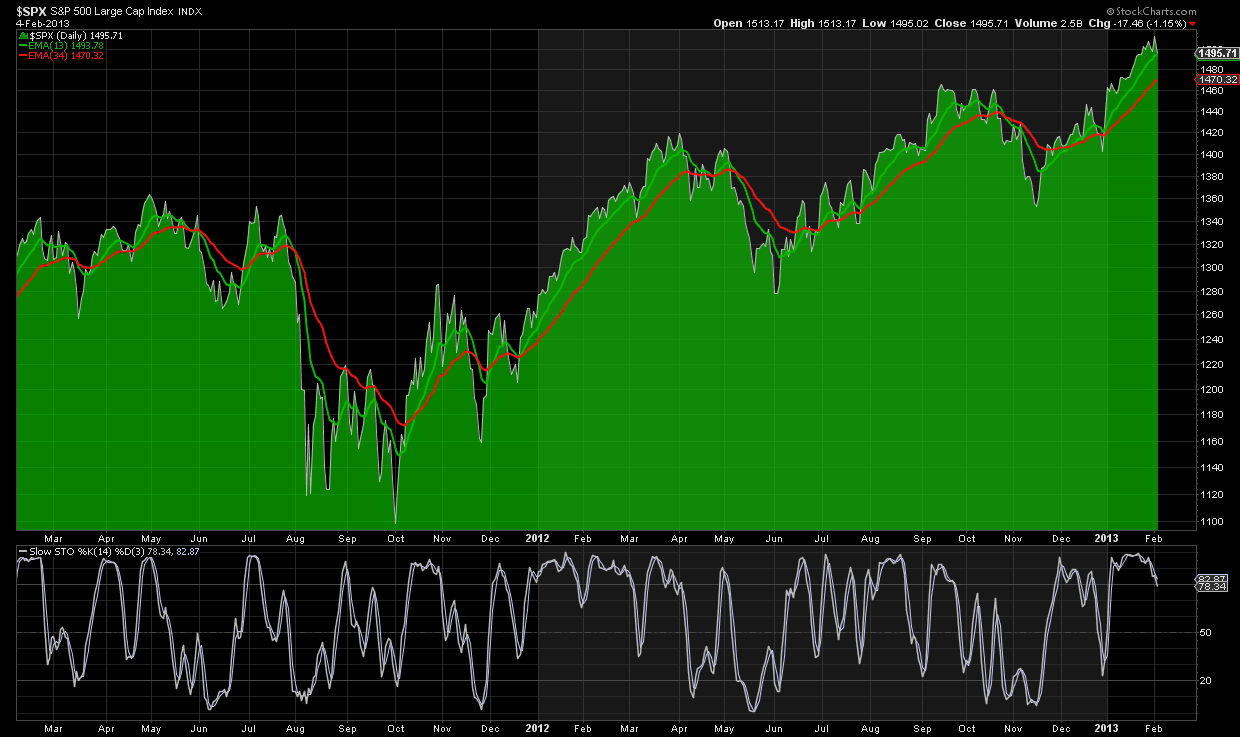
For the time being, this could just prove a shallow correction but a another break below 1496 will confirm the corrective nature of the decline. 1470 however is another important level as far as weekly prices are concerned. On a weekly level we would not want prices to close below that level. Why? Because our simple weekly EMA system gives a sell signal as shown below.

Disclosure: None of the information or opinions expressed in this blog constitutes a solicitation for the purchase or sale of any security or other instrument. Nothing in this article constitutes investment advice and any recommendations that may be contained herein have not been based upon a consideration of the investment objectives, financial situation or particular needs of any specific recipient. Any purchase or sale activity in any securities or other instrument should be based upon your own analysis and conclusions.

The breakout towards 1514 that followed gave some hope that the market was re-energised and was heading towards 1520 and why not higher. In our twitter update after Monday’s open we mentioned how crucial was the 1504 support for the bullish view. However the daily candle yesterday was so strong that it took back the whole candle from Friday’s breakout and then some.

The sequence of higher highs and higher lows ended yesterday. The much awaited correction is most probably on route towards 1470-80.

For the time being, this could just prove a shallow correction but a another break below 1496 will confirm the corrective nature of the decline. 1470 however is another important level as far as weekly prices are concerned. On a weekly level we would not want prices to close below that level. Why? Because our simple weekly EMA system gives a sell signal as shown below.

Disclosure: None of the information or opinions expressed in this blog constitutes a solicitation for the purchase or sale of any security or other instrument. Nothing in this article constitutes investment advice and any recommendations that may be contained herein have not been based upon a consideration of the investment objectives, financial situation or particular needs of any specific recipient. Any purchase or sale activity in any securities or other instrument should be based upon your own analysis and conclusions.
3rd party Ad. Not an offer or recommendation by Investing.com. See disclosure here or remove ads.
Which stock should you buy in your very next trade?
AI computing powers are changing the stock market. Investing.com's ProPicks AI includes 6 winning stock portfolios chosen by our advanced AI. In 2024 alone, ProPicks AI identified 2 stocks that surged over 150%, 4 additional stocks that leaped over 30%, and 3 more that climbed over 25%. Which stock will be the next to soar?
Unlock ProPicks AI