The rally we saw in US equity indexes on Wednesday didn't spill over into Thursday's action. The Benchmark S&P 500 spent the session in an extremely narrow trading range -- only 0.38% between its intraday low and high, the fourth narrowest trading range of 2015. It ended the session with a fractional loss of -0.11%
The yield on the 10-year note closed at 2.24%, down 3 bps from Wednesday's close.
Here is a snapshot of past five sessions.
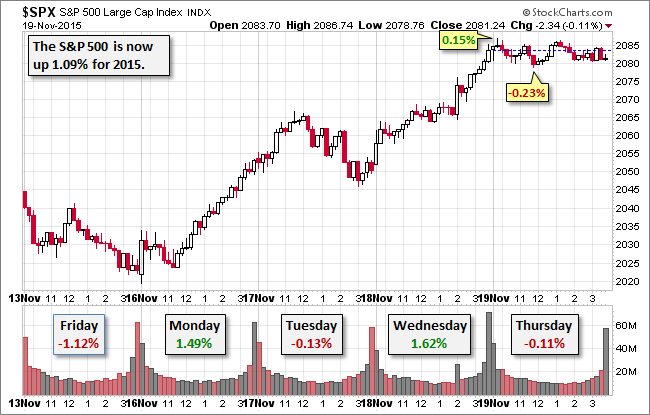
Here is a daily chart of the index. Trading volume was on the light side. The index remains above its 200-day price moving average.
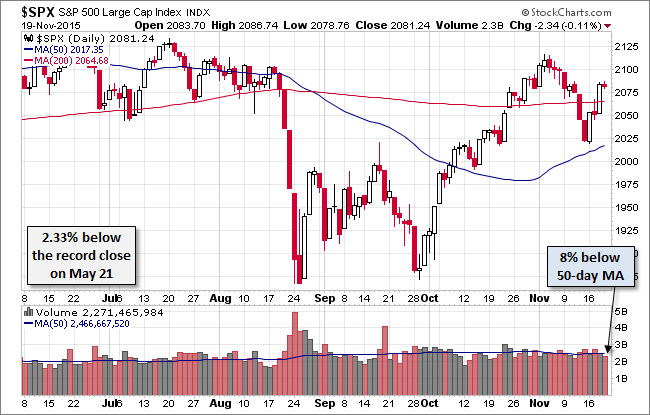
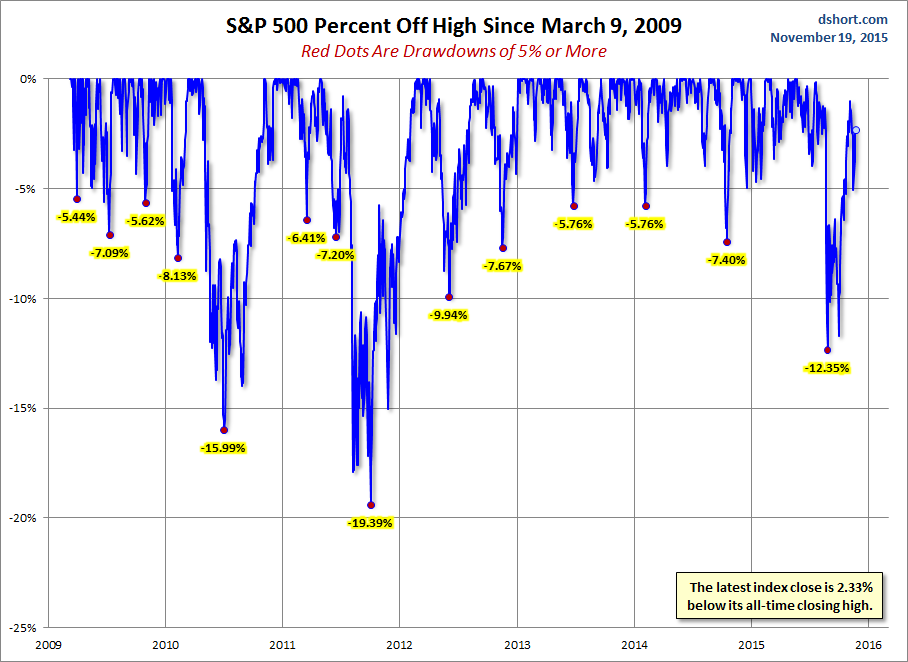
A Perspective on Drawdowns
Here's a snapshot of selloffs since the 2009 trough.
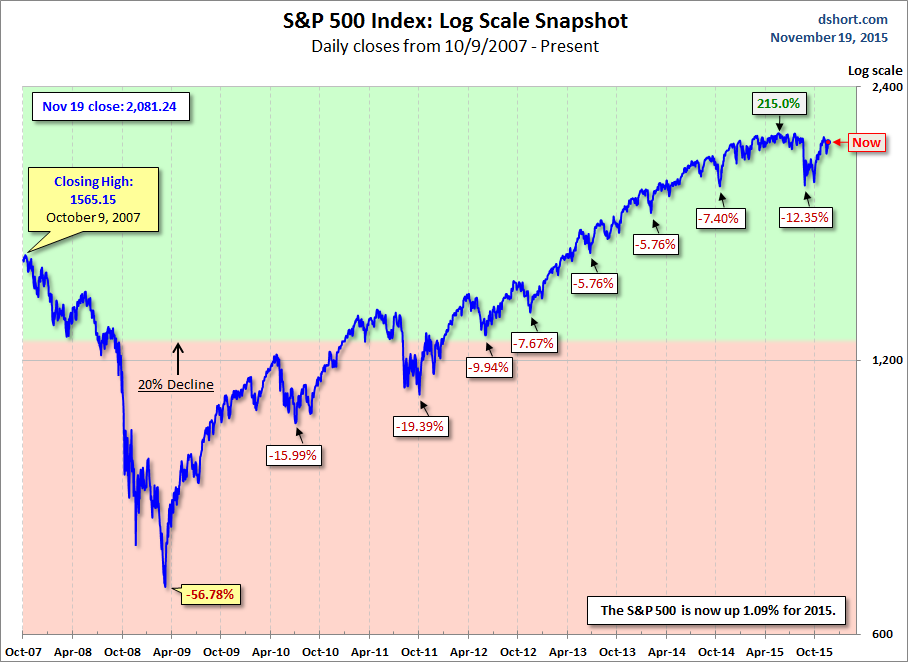
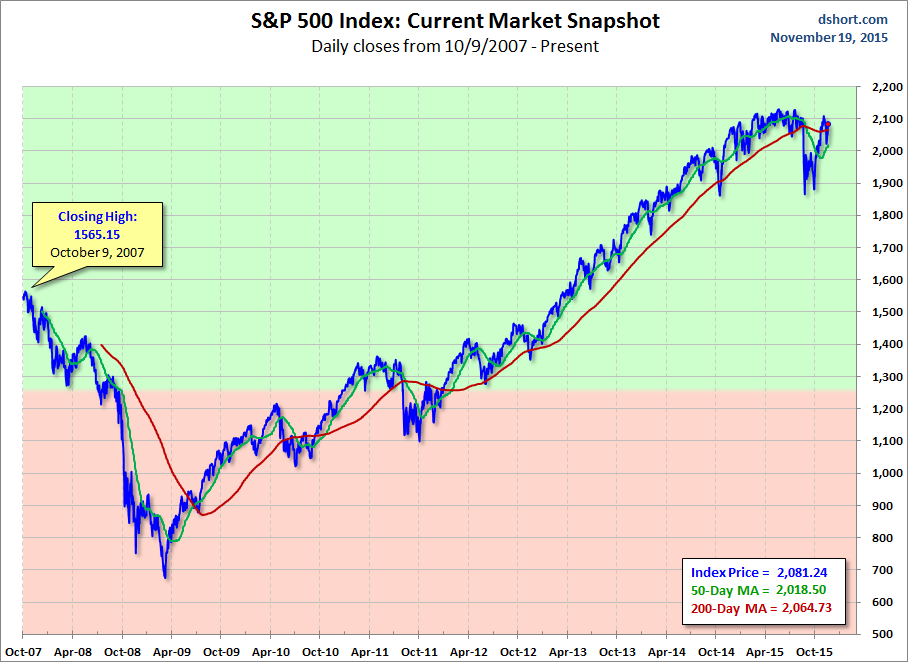
For a longer-term perspective, here is a log-scale chart base on daily closes since the all-time high prior to the Great Recession.
Here is the same chart with the 50- and 200-day moving averages. The 50 crossed below the 200 on August 28th.
Which stock should you buy in your very next trade?
AI computing powers are changing the stock market. Investing.com's ProPicks AI includes 6 winning stock portfolios chosen by our advanced AI. In 2024 alone, ProPicks AI identified 2 stocks that surged over 150%, 4 additional stocks that leaped over 30%, and 3 more that climbed over 25%. Which stock will be the next to soar?
Unlock ProPicks AI