Stock market today: S&P 500 ekes out gain as Trump says open to deals on tariffs
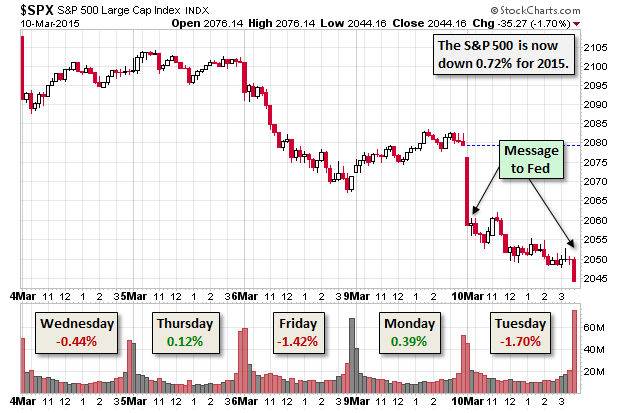
The US equity markets took a beating today. The benchmark S&P 500 plunged at the open and sold off through the day to close at its intraday low at -1.70%. This was the worst daily decline since January 5th. Also, it puts the index in the red year-to-date, down 0.72%, and 3.46% off its record close six sessions ago on March 3rd.
The pundits variously blame dollar strength and anxieties about a rate hike from the Fed. Either way, the market is apparently sending a message to the Fed in advance of its March meeting next week.
The yield on the 10-year note closed at 2.14%, down 6 bps from yesterday's close.
Here is a 15-minute chart of the last five sessions.
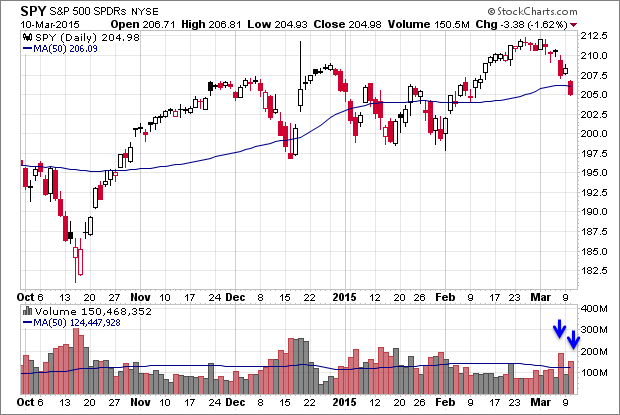
Here's a daily chart of the SPDR S&P 500 (ARCA:SPY) ETF, which give us a sense of investor participation. Volume spiked on today's selloff, but not as much as in the Friday decline.
A Perspective on Drawdowns
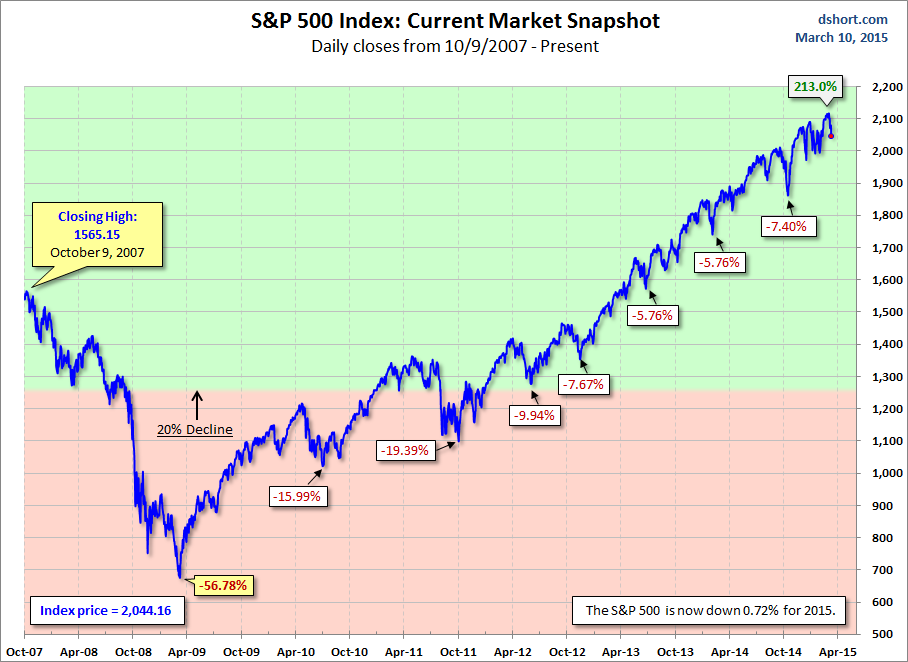
Here's a snapshot of selloffs since the 2009 trough.
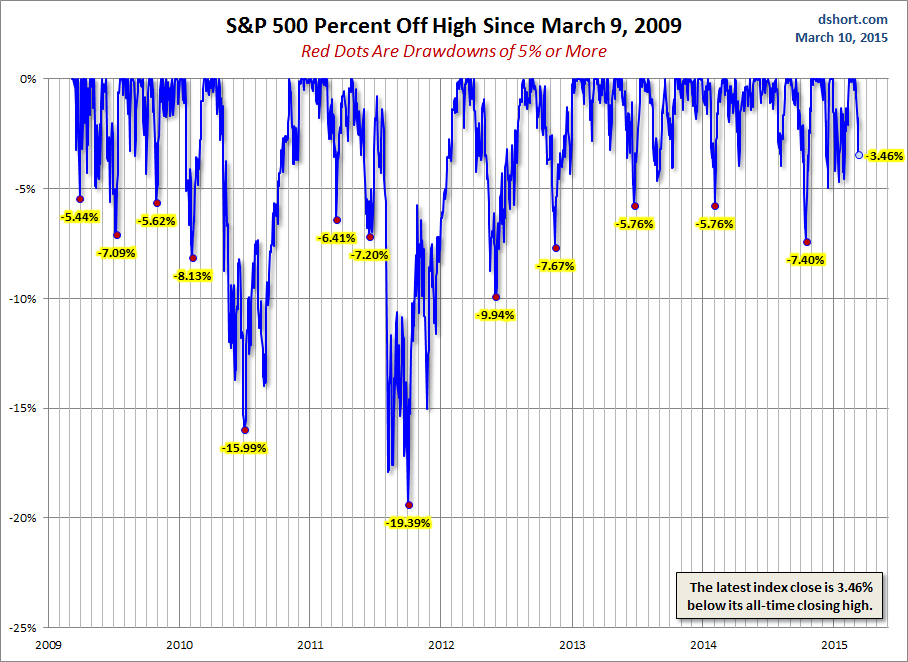
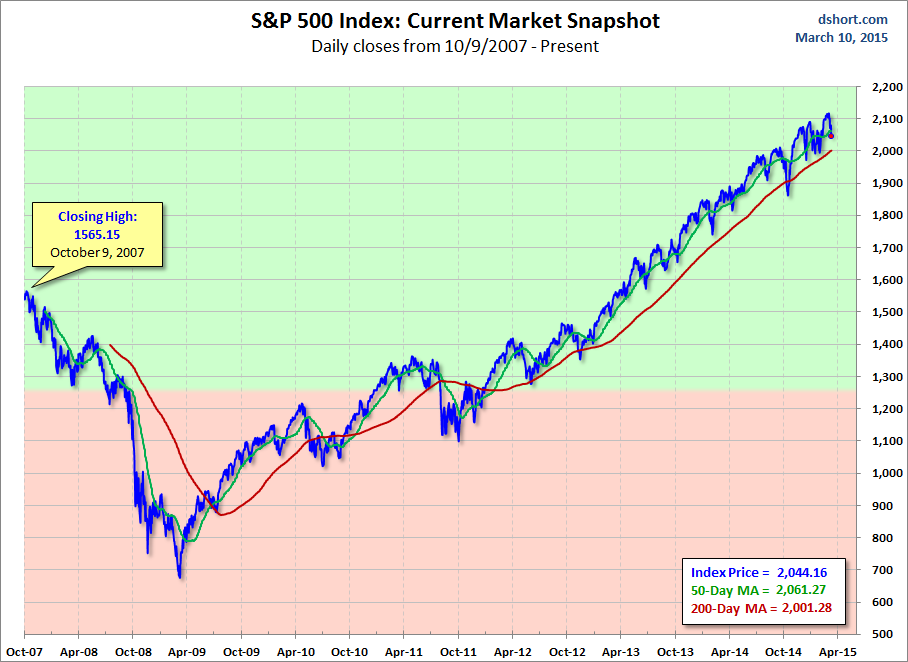
For a longer-term perspective, here is a pair of charts based on daily closes starting with the all-time high prior to the Great Recession.
Which stock should you buy in your very next trade?
AI computing powers are changing the stock market. Investing.com's ProPicks AI includes 6 winning stock portfolios chosen by our advanced AI. In 2024 alone, ProPicks AI identified 2 stocks that surged over 150%, 4 additional stocks that leaped over 30%, and 3 more that climbed over 25%. Which stock will be the next to soar?
Unlock ProPicks AI
