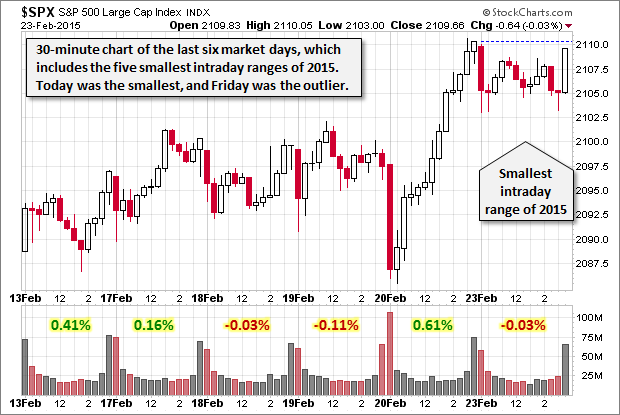
The S&P 500 spent the day in the shallow red and the smallest intraday range (-0.01% to -0.35%) of the year so far. In fact, the last six sessions include the five smallest intraday ranges of the 35 market days in 2015, with Friday being the outlier. The prevailing view is that the market is waiting on Fed Chair Yellen's semiannual congressional hearings. She will testify tomorrow at 10 AM ET to the Senate Banking Committee and Wednesday at 10 AM to the House Financial Services Committee.
The yield on the 10-year note closed at 2.6%, down seven bps from Friday's close.
Here is a 30-minute chart of the last six sessions, which includes those five miniscule intraday ranges.
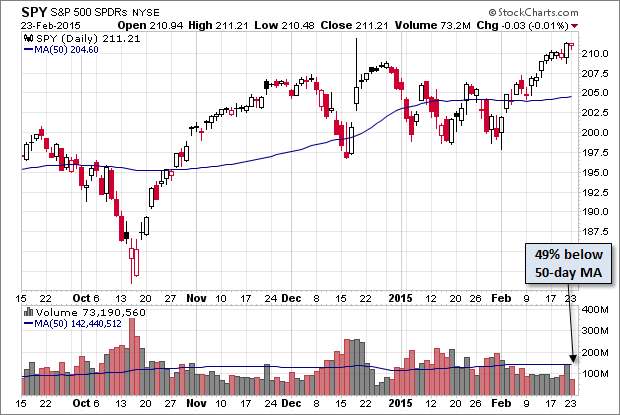
Here is a daily chart of the SPDR S&P 500 (ARCA:SPY) ETF, which gives a better sense of investor participation than the underlying index. Volume was about half its 50-day moving average.
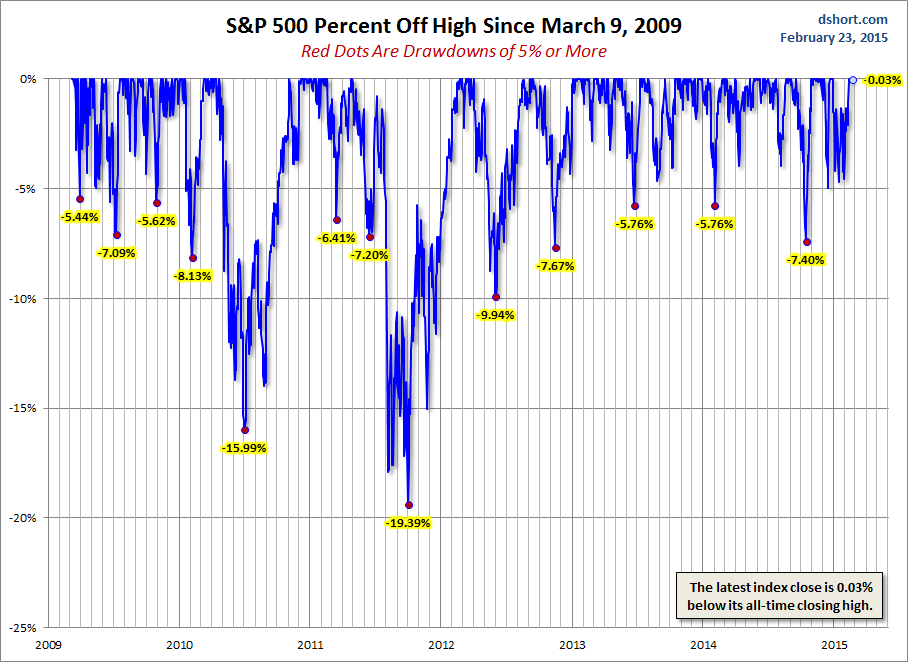
A Perspective on Drawdowns
Here's a snapshot of selloffs since the 2009 trough.
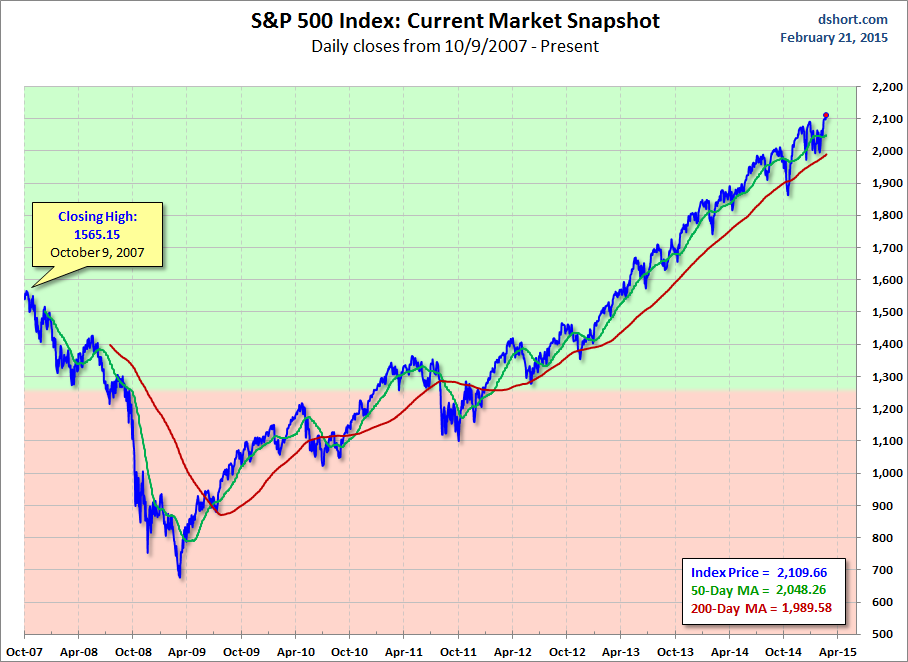
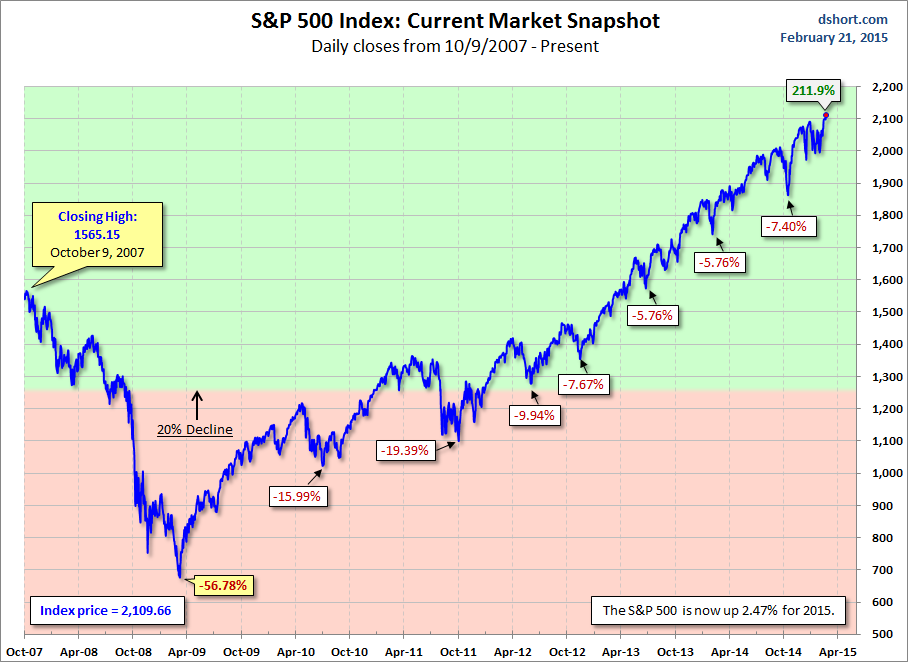
For a longer-term perspective, here is a pair of charts based on daily closes starting with the all-time high prior to the Great Recession.
Which stock should you buy in your very next trade?
AI computing powers are changing the stock market. Investing.com's ProPicks AI includes 6 winning stock portfolios chosen by our advanced AI. In 2024 alone, ProPicks AI identified 2 stocks that surged over 150%, 4 additional stocks that leaped over 30%, and 3 more that climbed over 25%. Which stock will be the next to soar?
Unlock ProPicks AI
