
The S&P opened near its daily high and oscillated around a 9 point range, closing in the middle, just below Wednesday's all-time high. The index saw a fractional daily loss of 0.02% and a YTD gain of 10.48%.

The U.S. Treasury puts the closing yield on the 10-year note at 2.27%.
Here is a daily chart of the S&P 500. Thursday's selling puts the volume 3% below its 50-day moving average.

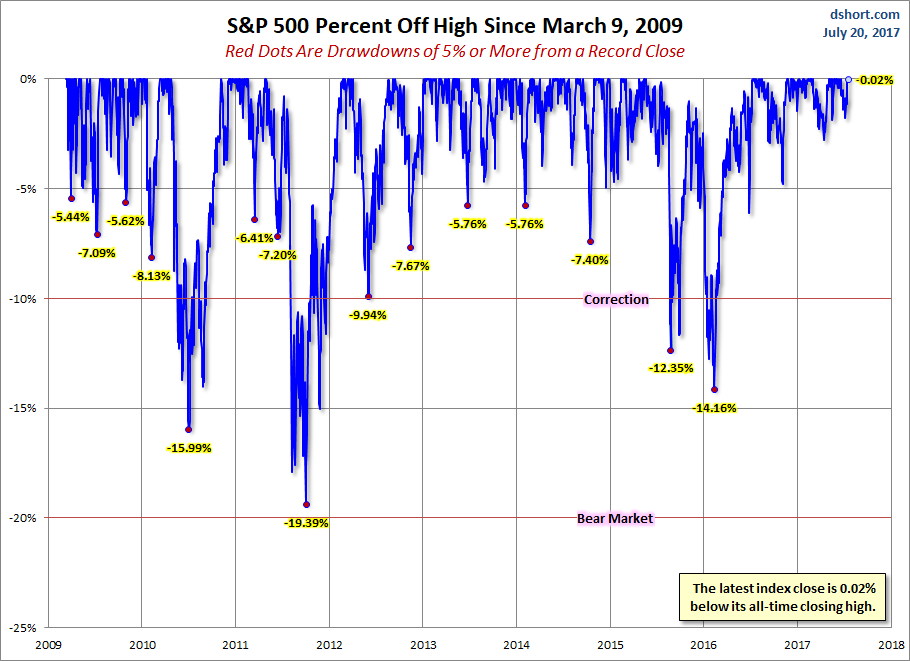
A Perspective on Drawdowns
Here's a snapshot of record highs and selloffs since the 2009 trough.
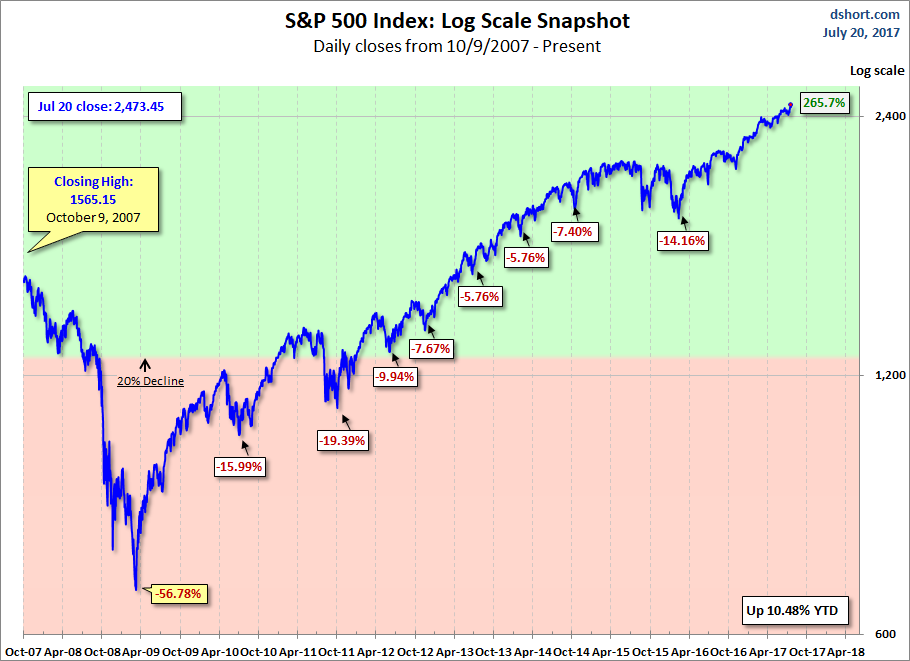
Here is a more conventional log-scale chart with drawdowns highlighted.
Here is a linear scale version of the same chart with the 50- and 200-day moving averages.

A Perspective on Volatility
For a sense of the correlation between the closing price and intraday volatility, the chart below overlays the S&P 500 since 2007 with the intraday price range. We've also included a 20-day moving average to help identify trends in volatility.

Which stock should you buy in your very next trade?
AI computing powers are changing the stock market. Investing.com's ProPicks AI includes 6 winning stock portfolios chosen by our advanced AI. In 2024 alone, ProPicks AI identified 2 stocks that surged over 150%, 4 additional stocks that leaped over 30%, and 3 more that climbed over 25%. Which stock will be the next to soar?
Unlock ProPicks AI