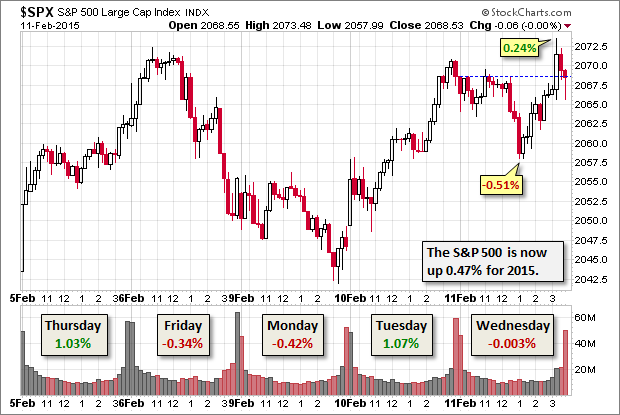
The S&P 500 spent the morning yesterday in a relatively narrow range with Tuesday's closing price as a glass ceiling. It began selling off to its -0.51% intra-day low during the lunch hour and then slowly chugged to its 0.24% intra-day high in the final hour.
But the gain didn't hold, and the index ended flat to two decimal places. As for that intra-day range of 0.75%, it's the third smallest of the 28 sessions so far this year.
The yield on the 10-Year note closed at 2.00%, down one bp from Tuesday's close.
Here is a 15-minute chart of the last five sessions

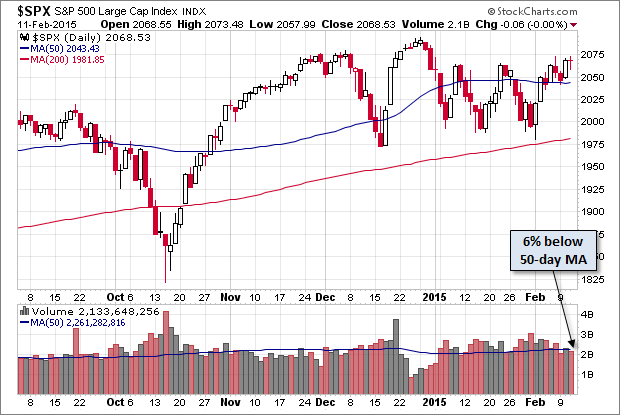
Here is a daily chart of the index, which hold a fractional 0.47% year-to-date gain. Trading volume was unexceptional.

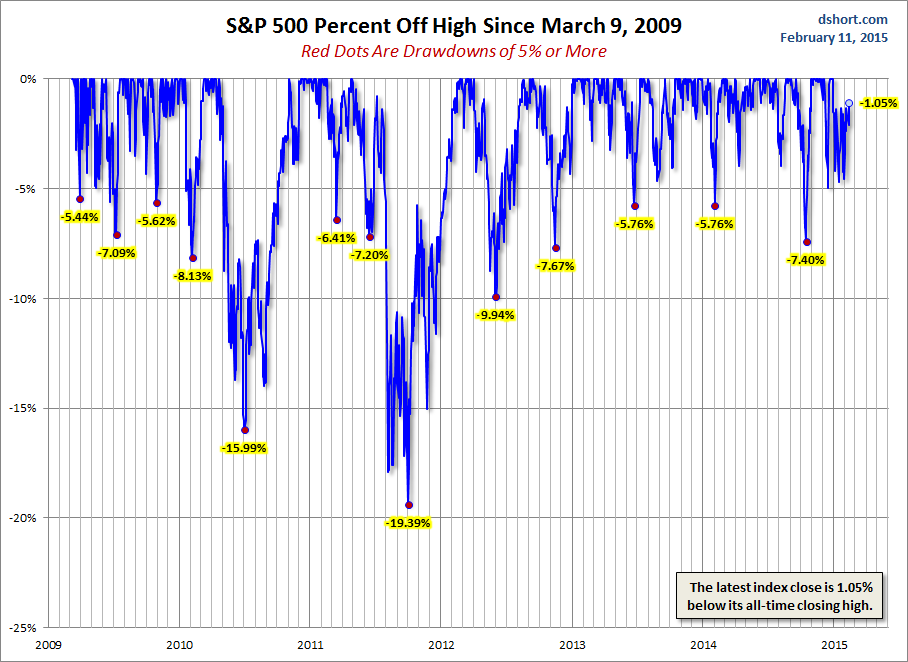
A Perspective on Drawdowns
Here's a snapshot of sell-offs since the 2009 trough. The S&P 500 is 1.05% off its record close on December 29th.
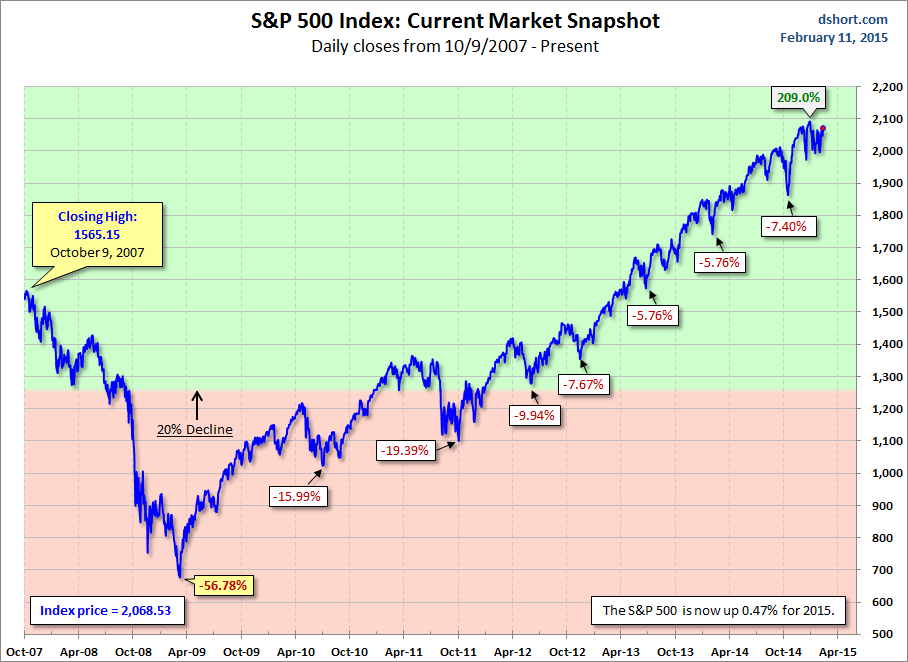
For a longer-term perspective, here is a pair of charts based on daily closes starting with the all-time high prior to the Great Recession.
Which stock should you buy in your very next trade?
With valuations skyrocketing in 2024, many investors are uneasy putting more money into stocks. Unsure where to invest next? Get access to our proven portfolios and discover high-potential opportunities.
In 2024 alone, ProPicks AI identified 2 stocks that surged over 150%, 4 additional stocks that leaped over 30%, and 3 more that climbed over 25%. That's an impressive track record.
With portfolios tailored for Dow stocks, S&P stocks, Tech stocks, and Mid Cap stocks, you can explore various wealth-building strategies.


