Trump announces 50% tariff on copper, effective August 1
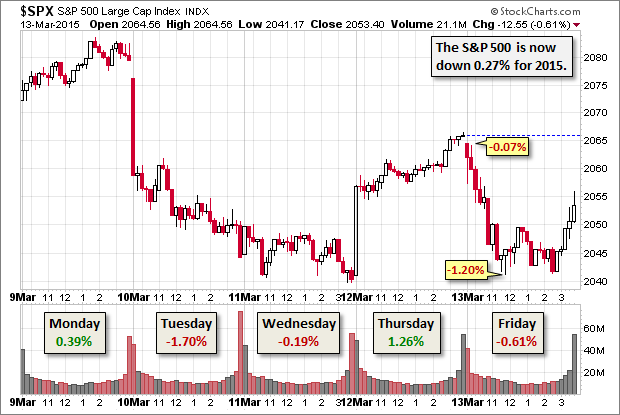
The S&P 500 sold off steadily from the opening bell, which was preceded by deflationary Producer Price Index data and followed by a disappointing Consumer Sentiment report. The index hit its -1.20% intraday low in the late morning and hovered in a narrow range until a modest rally in the final hour trimmed the daily loss to 0.61%.
West Texas Crude ended the day back below $45 per barrel level, and the euro closed around $1.05. Time to book that European vacation!
Next week the market will continue to watch oil and the dollar, but main focus of the pundits will be the March FOMC meeting, which will include a Summary of Economic Projections and a press conference by the Chair on Wednesday afternoon.
Here is a 15-minute chart of the last five sessions.
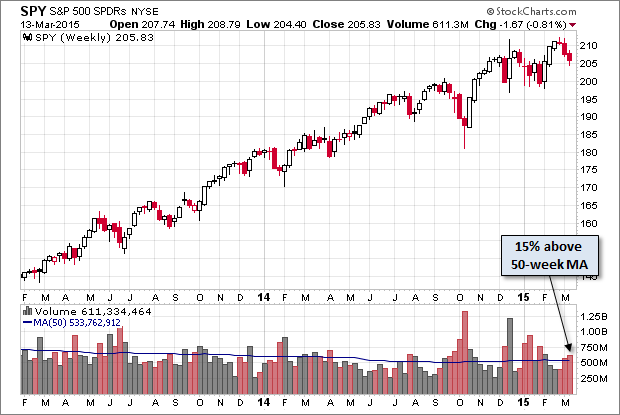
Here's a weekly chart of the SPDR S&P 500 (ARCA:SPY) ETF, which gives us a good sense of investor participation. Volume has been rising with the recent selling.
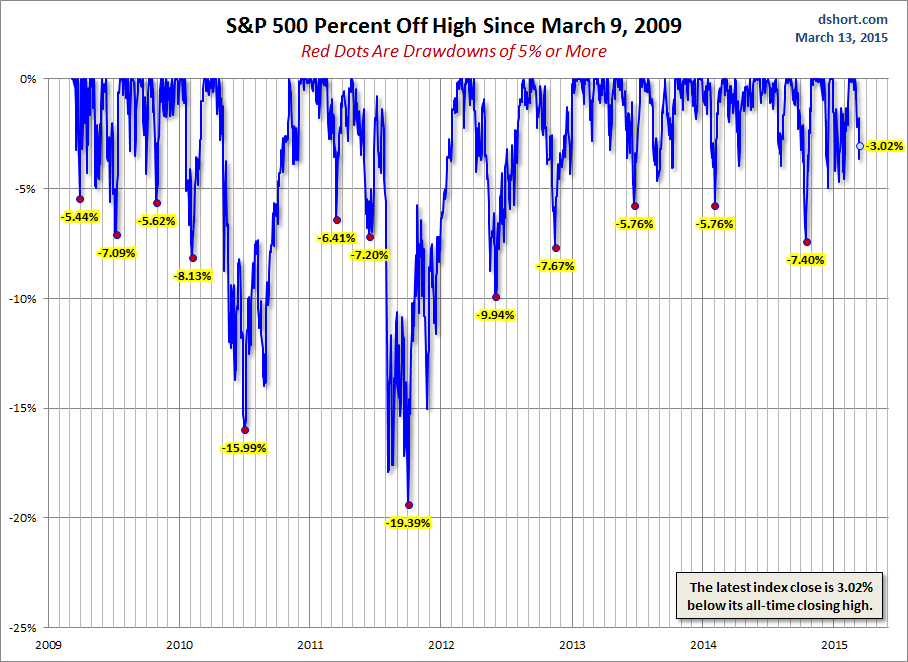
A Perspective on Drawdowns
Here's a snapshot of selloffs since the 2009 trough.
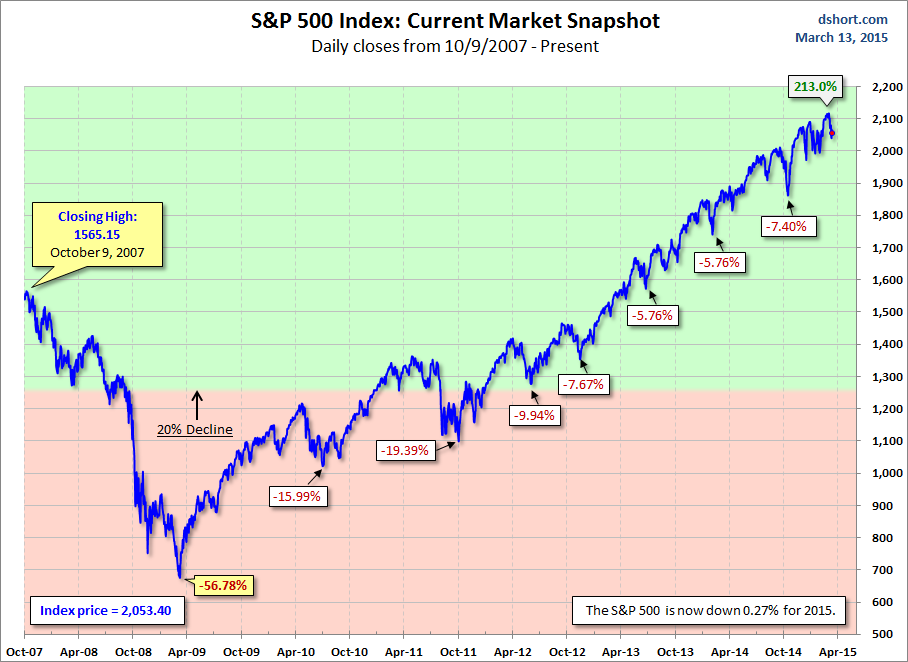
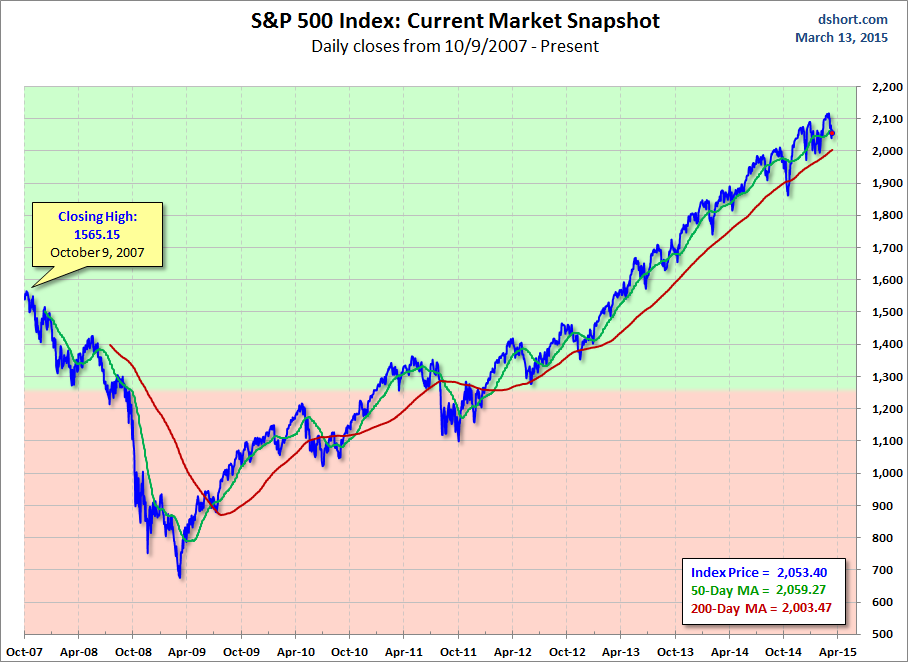
For a longer-term perspective, here is a pair of charts based on daily closes starting with the all-time high prior to the Great Recession.

