Stock market today: S&P 500 ekes out gain as Trump says open to deals on tariffs
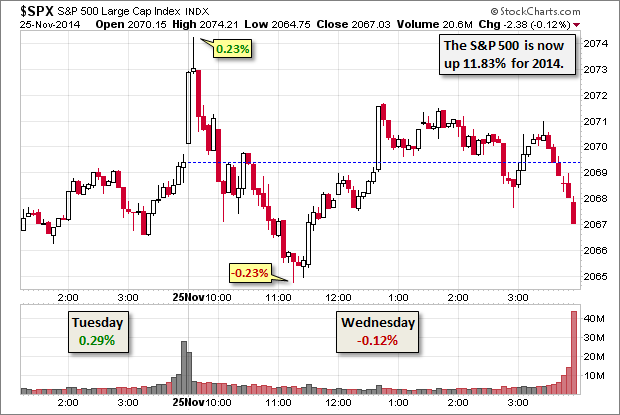
The S&P 500 traded in a bit of a confused fashion during the morning, oscillating between its 0.23% and -0.23% intraday peak and trough in the first two hours of trading. The Second Estimate of Q3 GDP beat forecasts with its upward revision from 3.5% to 3.9%. But Consumer Confidence unexpectedly dropped, probably not a welcome signal as we approach the holiday shopping season. The index then dithered through the day in a narrow range, the only drama being whether it would log its 47th record close of 2014. It did not, ending the day with a fractional -0.12% decline. But perhaps tomorrow's close will give us a rationale for an extra helping of Thanksgiving dressing on Thursday.
The yield on the U.S. 10-Year note ended the day at 2.27%, its lowest close in over a month (the 2.25% on October 22nd).
Here is a 15-minute chart of the past five sessions.

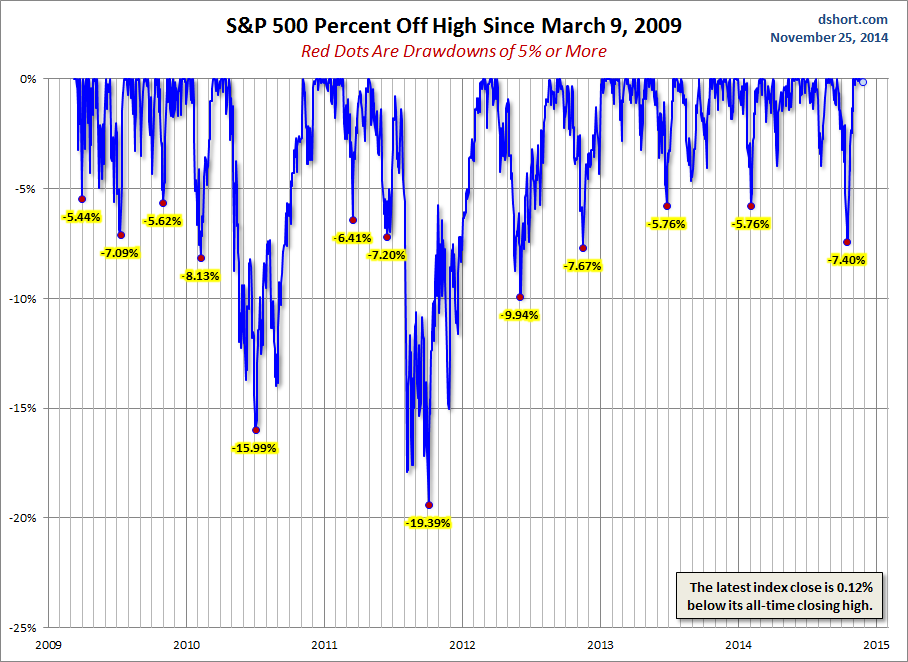
A Perspective on Drawdowns
How close was the October dip to an "official" correction, generally defined as a 10% drawdown from a high (based on daily closes)? The chart below incorporates a percent-off-high calculation to illustrate the drawdowns greater than 5% since the trough in 2009.

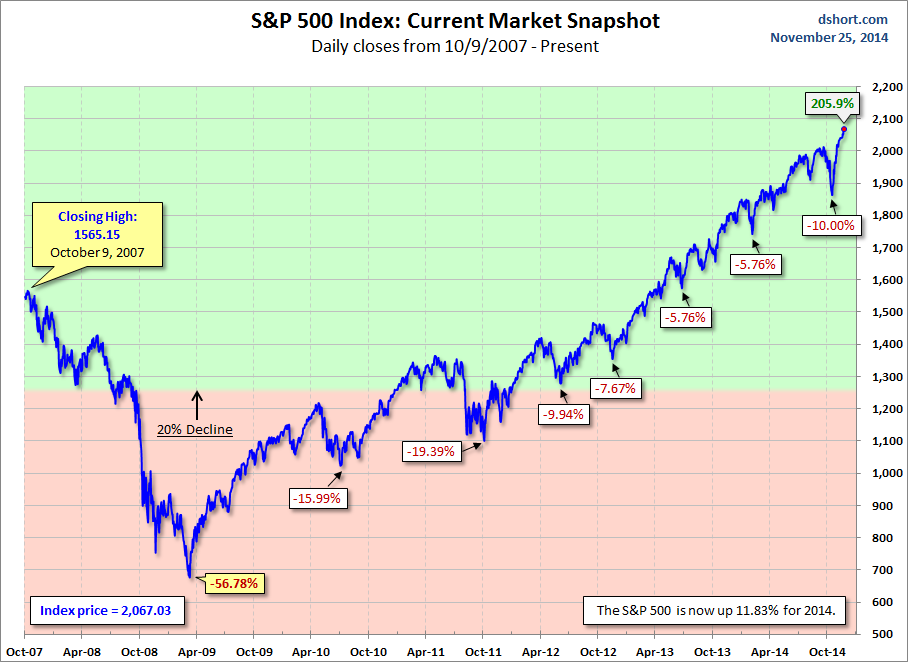
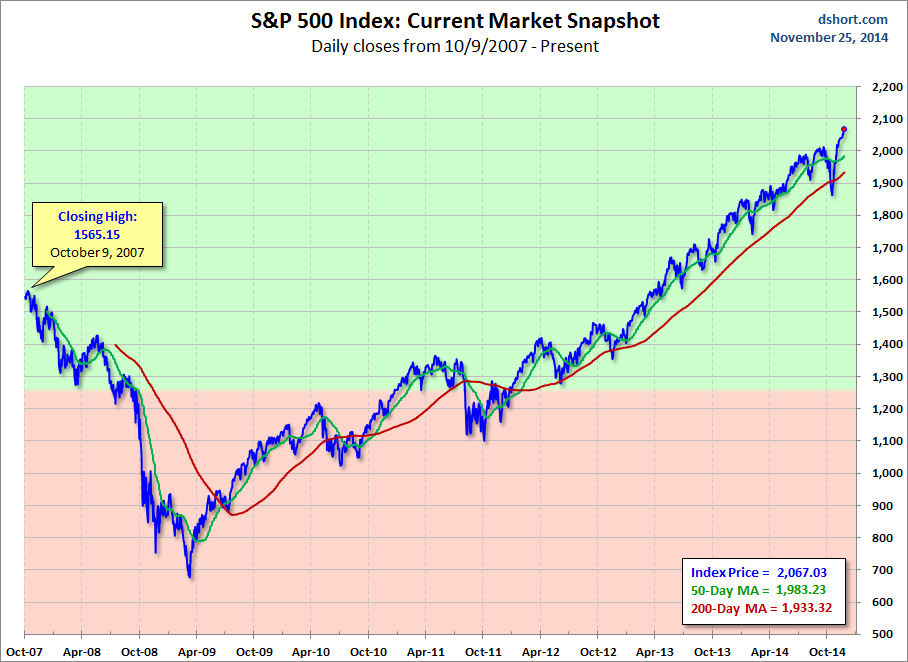
For a longer-term perspective, here is a pair of charts based on daily closes starting with the all-time high prior to the Great Recession.


Which stock should you buy in your very next trade?
With valuations skyrocketing in 2024, many investors are uneasy putting more money into stocks. Unsure where to invest next? Get access to our proven portfolios and discover high-potential opportunities.
In 2024 alone, ProPicks AI identified 2 stocks that surged over 150%, 4 additional stocks that leaped over 30%, and 3 more that climbed over 25%. That's an impressive track record.
With portfolios tailored for Dow stocks, S&P stocks, Tech stocks, and Mid Cap stocks, you can explore various wealth-building strategies.
