Bitcoin price today: slips to $117k from record peak; US inflation awaited
January volatility continued on Thursday. The S&P 500 opened higher and quickly rose to its 1.06% intraday high. It then plummeted to its -0.49% low at the end of the first hour of trading. It then oscillated into the green and traded sideways to its 0.55% closing gain. The index is down 7.37% year to date and 11.14% off its record close last May. The general view is that Thursday's gain was largely supported by a rise in oil prices. West Texas Light Crude closed the day with a 4.85% gain.
The yield on the 10-year note closed at 2.00%, down 2 basis points from the previous close.
Here is a snapshot of past five sessions.
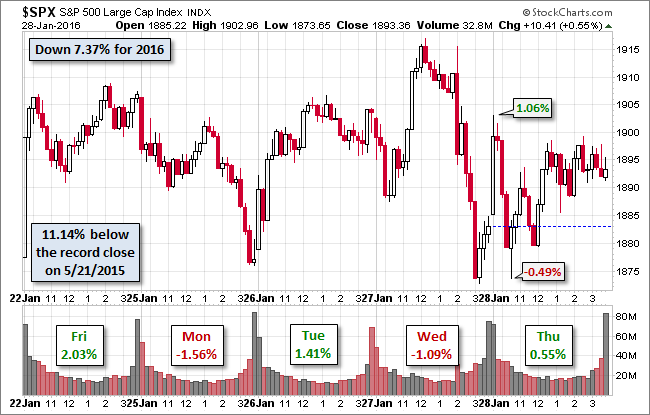
Here is a daily chart of the index. Volume inched up in Thursday's volatile trade.
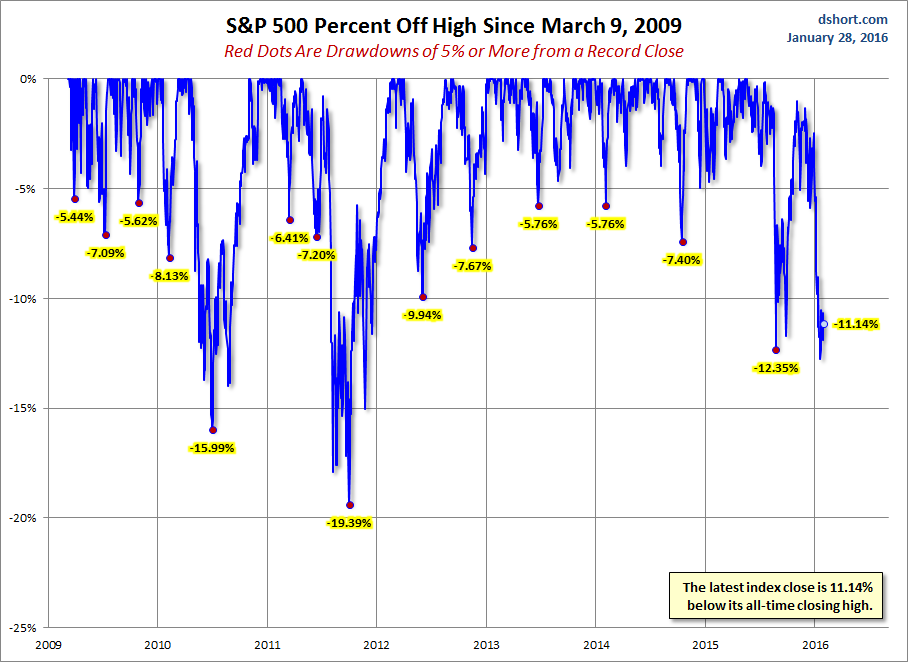
A Perspective on Drawdowns
Here's a snapshot of selloffs since the 2009 trough.
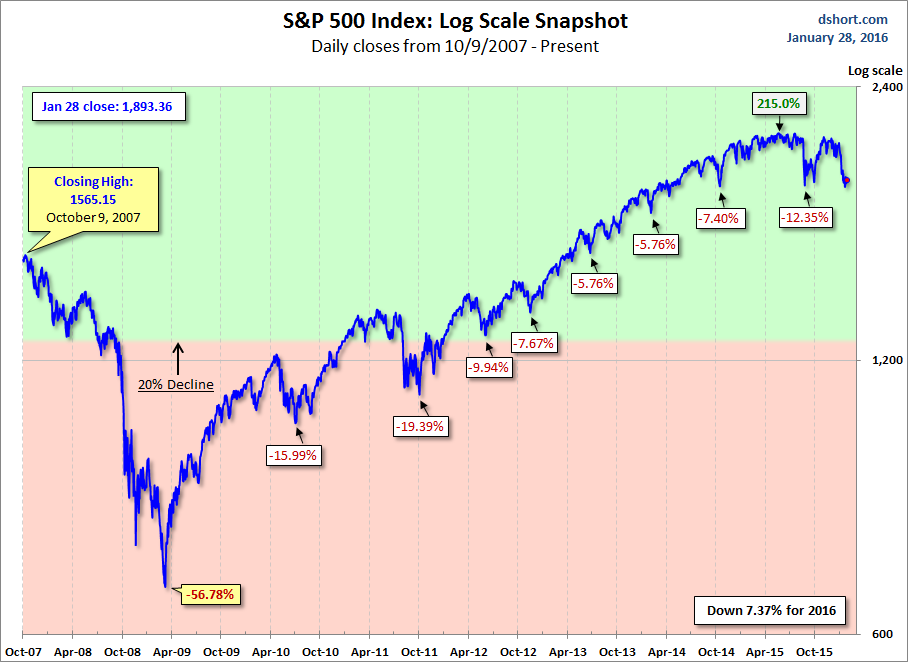
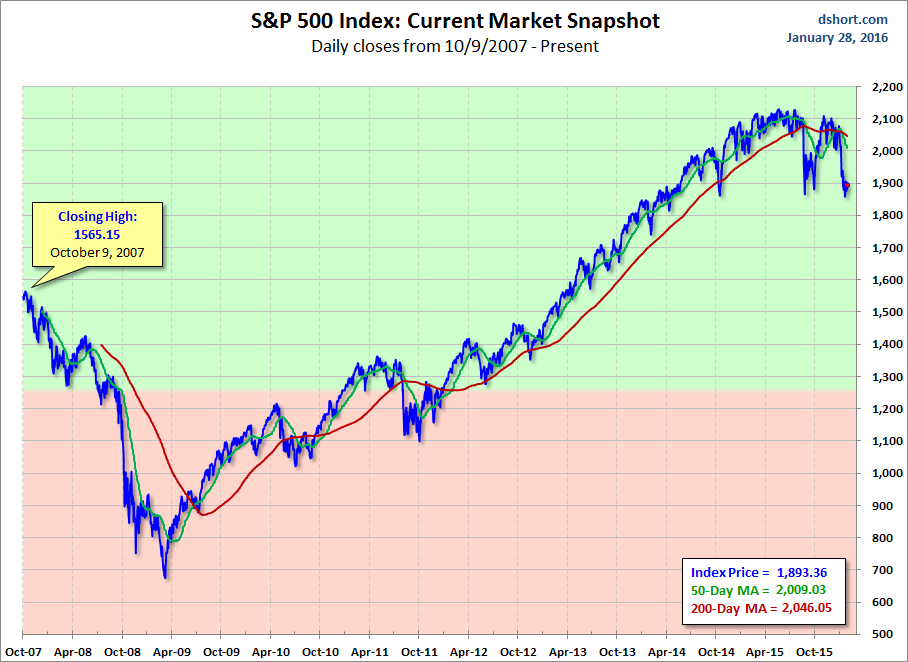
For a longer-term perspective, here is a log-scale chart base on daily closes since the all-time high prior to the Great Recession.
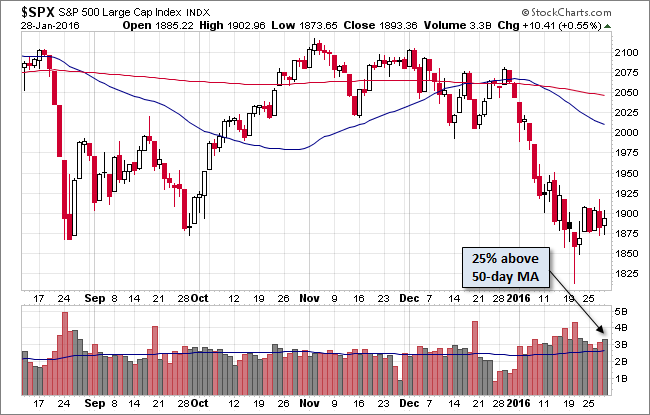
Here is the same chart with the 50- and 200-day moving averages.
Which stock should you buy in your very next trade?
With valuations skyrocketing in 2024, many investors are uneasy putting more money into stocks. Unsure where to invest next? Get access to our proven portfolios and discover high-potential opportunities.
In 2024 alone, ProPicks AI identified 2 stocks that surged over 150%, 4 additional stocks that leaped over 30%, and 3 more that climbed over 25%. That's an impressive track record.
With portfolios tailored for Dow stocks, S&P stocks, Tech stocks, and Mid Cap stocks, you can explore various wealth-building strategies.
