The volatility index, the VIX, closed at a near record low on Friday, July 14, 2017. Since 1990, only two days have seen the VIX close lower: December 23, 1993 at 9.48 and December 22, 1993 at 9.31! (data from Yahoo) Finance).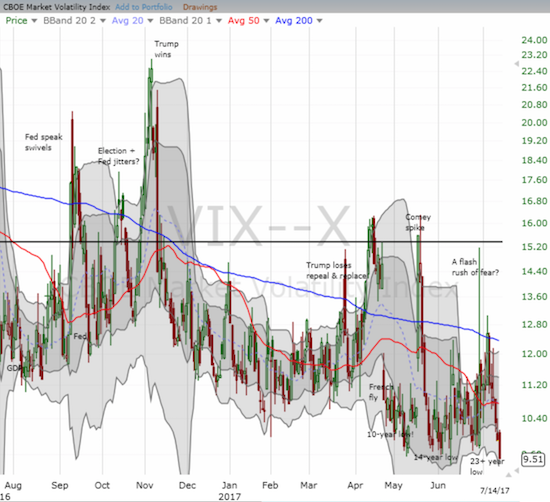
The volatility made a marginal new low, but hit a major milestone. Only two other days, nearly 24 years ago, have seen the VIX close at a lower level than now.
As I keep emphasizing during these periods of extremely low volatility, these VIX readings are near-term bullish and not bearish as one might assume. So it is quite appropriate on this day that the S&P 500 (SPDR S&P 500 (NYSE:SPY)) convincingly punched through its previous all-time high. There was little hesitation as the index exceeded the previous high by 6 points.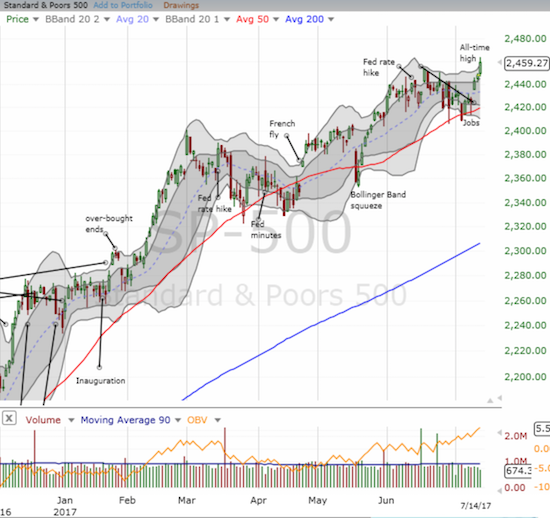
The S&P 500 firmly printed a fresh all-time high by extending beyond its upper-Bollinger® Band (BB).
The NASDAQ and the PowerShares QQQ ETF (NASDAQ:QQQ) came up just short of their respective all-time highs.
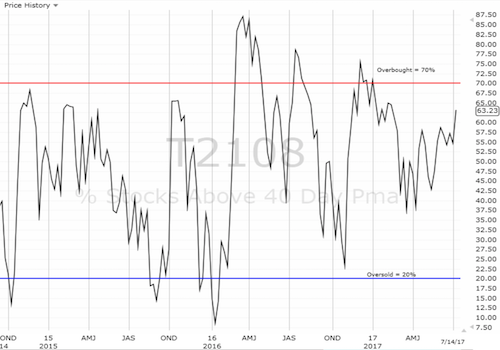
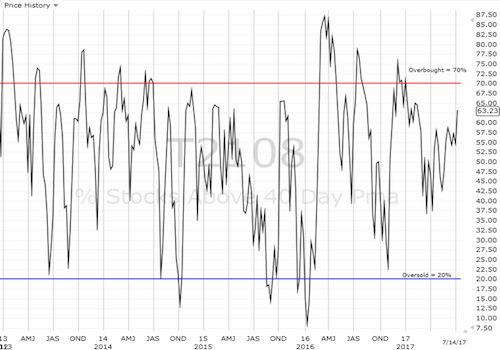
I now have to notch my short-term trading call back to cautiously bullish. The reading is cautious for now because I want to see what happens when AT40 (T2108), the percentage of stocks trading above their respective 40-day moving averages (DMAs), reaches the overbought threshold of 70%. If AT40 fades, I may have to revert all the way down to bearish. If AT40 rises to the occasion, I will drop the caution from my bullishness.
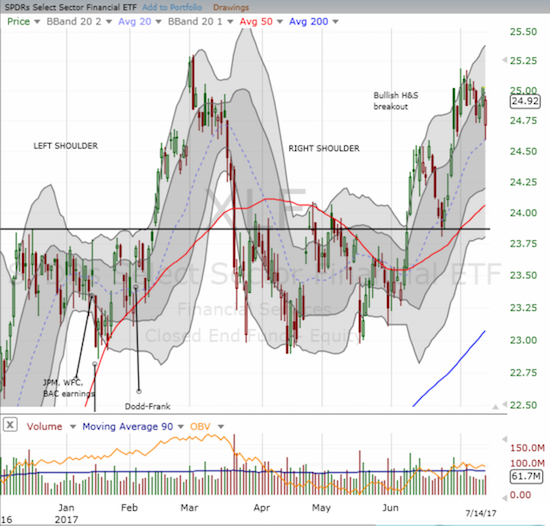
With earnings season getting into full gear, there is not much more to say about the market here. My earnings related trading got off to a poor start with a batch of earnings in the financials that disappointed the market. The gap down cut my call options on the Financial Select Sector SPDR ETF (NYSE:XLF) in half.
Fortunately, buyers rushed into the gap and reduced my paper loss. I will take this as a signal to go back to my usual routine of playing earnings after the news and after the market’s initial reactions. For example, I resisted the temptation to double down, and I will wait to take further action until after the next batch of earnings in the financials.
The Financial Select Sector SPDR ETF (XLF) disappointed at the open in response to earnings, but buyers immediately stepped into the breach.
Black line: AT40 (T2108) (% measured on the right)
Red line: Overbought threshold (70%); Blue line: Oversold threshold (20%)
Be careful out there!
Full disclosure: long AAPL puts, long NFLX puts, long TSLA puts, long TGT calls, long XLF calls
*Charting notes: FreeStockCharts.com uses midnight U.S. Eastern time as the close for currencies.
Author's Note: “Above the 40” uses the percentage of stocks trading above their respective 40-day moving averages (DMAs) to assess the technical health of the stock market and to identify extremes in market sentiment that are likely to reverse. Abbreviated as AT40, Above the 40 is an alternative label for “T2108” which was created by Worden. Learn more about T2108 on my T2108 Resource Page. AT200, or T2107, measures the percentage of stocks trading above their respective 200DMAs.
Active AT40 (T2108) periods: Day #354 over 20%, Day #168 over 30%, Day #35 over 40%, Day #6 over 50%, Day #1 over 60% (overperiod, ending 7 days under 60%), Day #114 under 70%

