Amazon beats second-quarter estimates, but AWS margins miss market hopes
Stocks enjoyed another bullish day, with the S&P 500 gaining 0.42% and Dow 30 a more modest 0.23%. Compared to Monday’s gains, yesterday's rally appears to be more “legitimate”. The direction was actually pointing higher, as evident via the Futures charts compared to the steep decline on Monday. In terms of correlation, the S&P 500 has finally managed to outdo Dow 30 after being under its shadow for the past few trading days, but that may have to do with the fact that Dow 30 endured a smaller bearish pullback on Wednesday, and as such was afforded less space for bullish recovery yesterday.
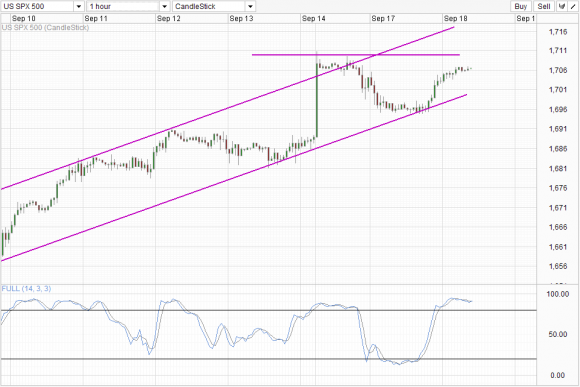
S&P 500 Hourly Chart
Absolute stock prices for S&P 500 is at all time high, but that is a red herring as Futures prices are staying below the highs from Monday gap, mostly trading around/below the consolidation zone of Monday session. Hence, do not automatically assume that a bullish breakout has already begun. Furthermore, Stochastic readings are heavily Oversold, and increases the difficulty for price to break Monday highs. With Channel Bottom rising, it is possible that we will witness a technical squeeze which will send prices either sharply higher or lower during US session tonight. This is in line with the FOMC event risk happening at 2pm EDT today, with market already pricing in a 10% tapering event according to latest analysts poll. Even if Fed meet expectations and carry out a taper, it is possible that sharp decline in stock prices may be seen, most likely resulting in the break of Channel Bottom. The only question is whether such a bearish move will be able to have good follow-through. In this regard, a breach of 1,690 and preferably below 1,680 will provide confidence that the decline may be able to last the mile.
It is more difficult to contemplate upsides as a non-tapering outcome will only fuel increased speculation on the final 2 FOMC meeting in 2013 where Bernanke is still around. As such, any resulting rally will most likely be met with bears seeking better selling price. From a technical perspective, if prices did rally and break above 1,710 but failed to push above Channel Top, watch out for a pullback towards 1,710 level again which may cascade into a strong bearish momentum once again.
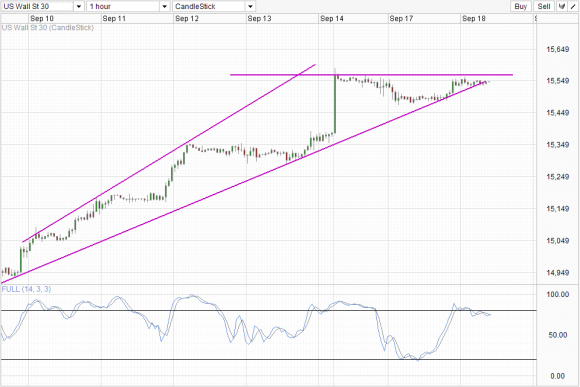
Dow 30 Hourly Chart
The same applies for Dow 30, but short-term technical outlook for Dow is more bearish, with prices already trading below the lower trendline. Stochastic readings are also showing a Bearish Cycle signal currently, increasing the likelihood of price heading towards 15,350. Similarly to S&P 500, price will need to break the consolidation range of 12-13th Sep in order to impair current bullish momentum.
On a separate note, as Dow 30 is the more bearish one, if a non-tapering event does sent prices higher and the 15,565+ ceiling still holds after a post event pullback, the chances of S&P 500 holding its post event gains becomes higher, and decreases the likelihood of a spectacular eventual bearish move described previously. The key for tonight is not the immediate outcome, but how market moves following the initial rally/sell-off, and that will shape up direction in Q4.
Original post
Which stock should you buy in your very next trade?
AI computing powers are changing the stock market. Investing.com's ProPicks AI includes 6 winning stock portfolios chosen by our advanced AI. In 2024 alone, ProPicks AI identified 2 stocks that surged over 150%, 4 additional stocks that leaped over 30%, and 3 more that climbed over 25%. Which stock will be the next to soar?
Unlock ProPicks AI
