🏄 Grow your portfolio even on vacation with InvestingPro | Summer Sale 50% OFFCLAIM SALE

Russell 2K: Was That A Topping Pattern At Resistance?

Published 11/10/2014, 11:03 AM

 The Russell 2000

Don't underestimate the importance of what the Russell 2000 does from here.

About a month ago, small caps found themselves oversold, on support and poised for a rally. I shared why the Power of the Pattern thought they were poised to rally in this post. The very next day, small caps started screaming higher, out performing the S&P 500 by a large percentage.  Well, that is now the past.

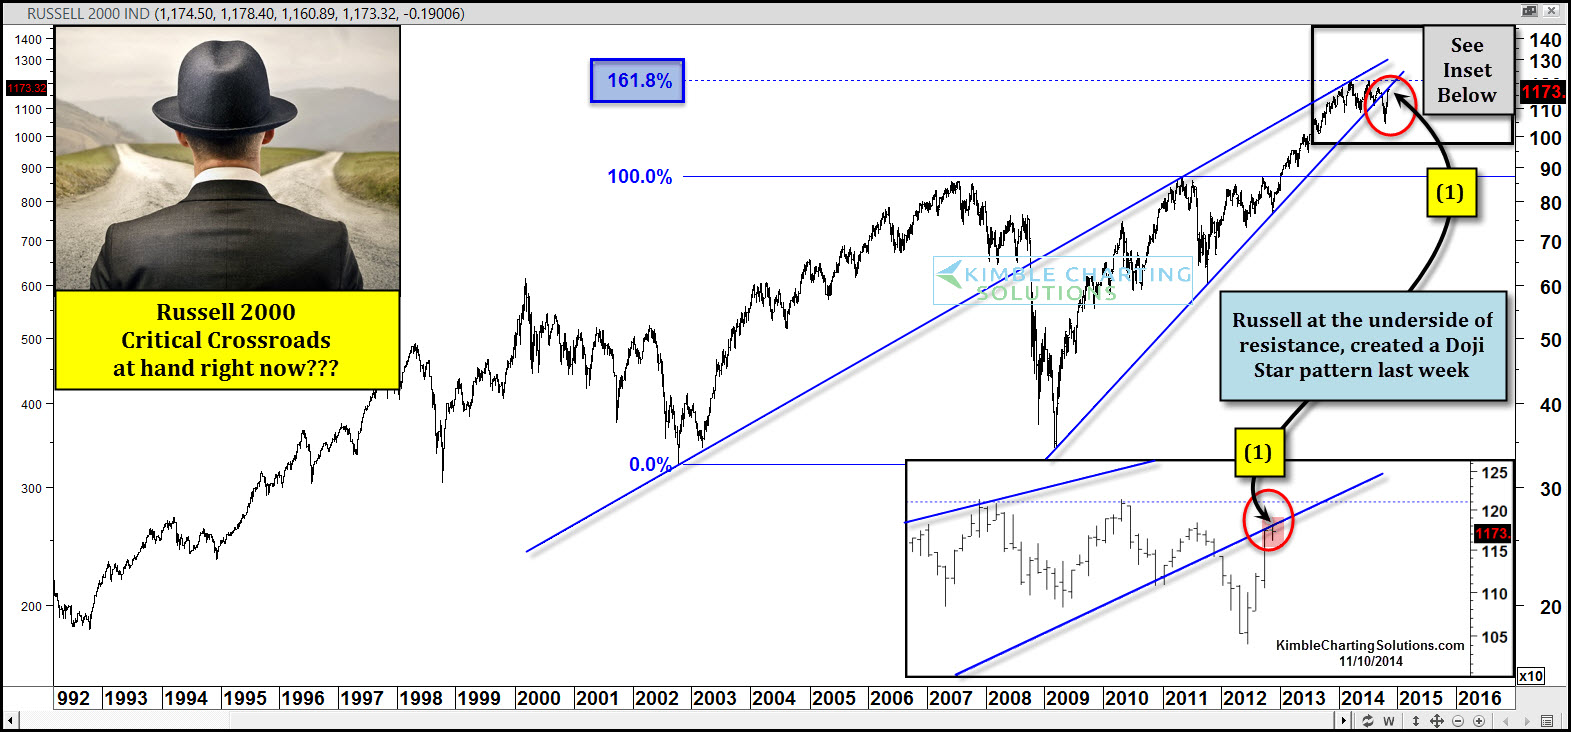
Turning the page forward to current conditions, what does the Russell look like today? In the chart above, I applied Fibonacci to the 2002 lows and the 2011 highs. As you can see, the Fibonacci 161% Extension level seems to be heavy resistance this YEAR, as the Russell has had little success breaking from this level for the past 11 months. 

The strong rally of late has taken the index to the underside of old support drawn off the higher lows, coming off the 2009 low. At this time the Russell is kissing the underside of resistance as it created a "Weekly Doji Star" pattern last week at (1) above. Doji Star patterns at resistance can become signs of a top.

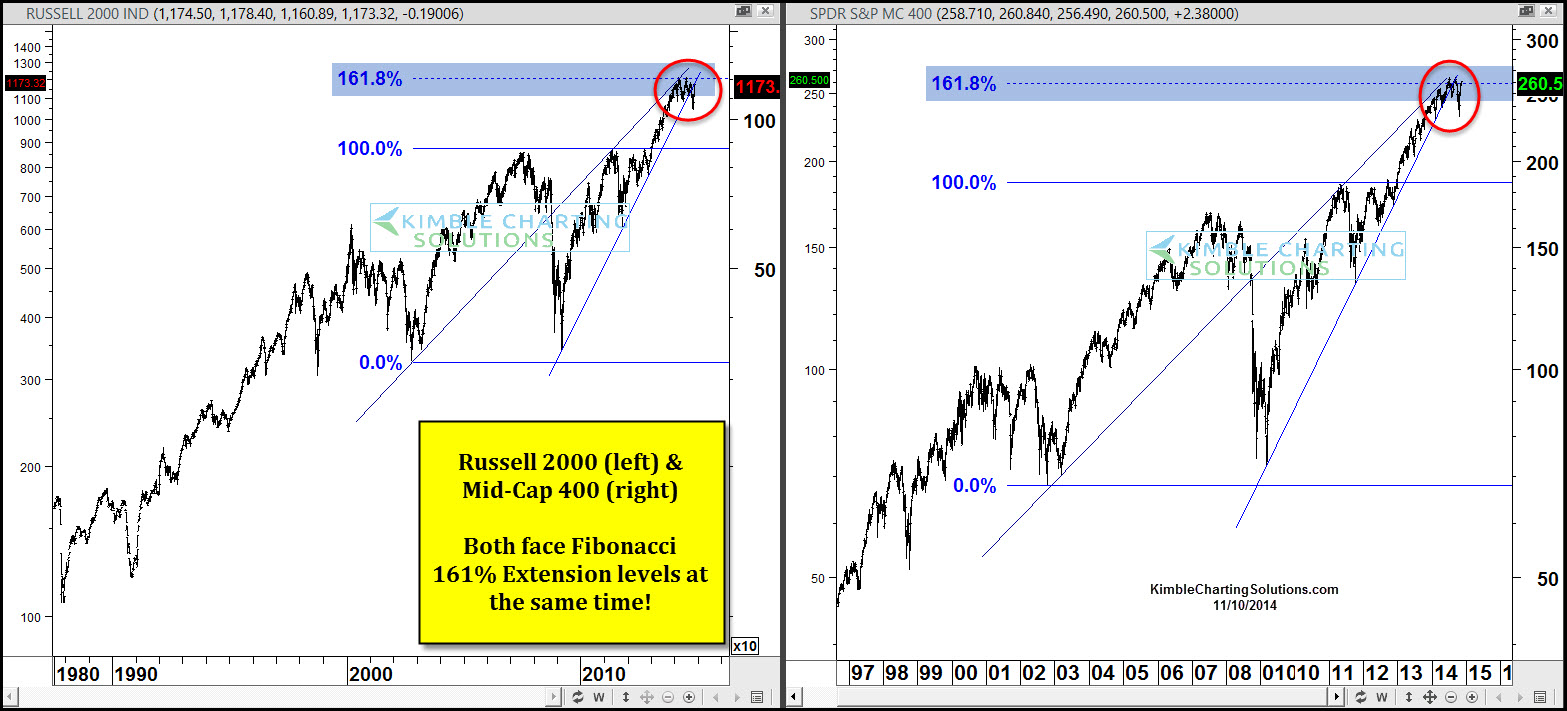
Russell 2k (L), Mid-Cap 400

Does the phrase "So goes small caps, so goes the broad markets" apply here? Humbly I think it does!  What these two do from here, could tell us a ton about where the S&P 500 is at year end.

3rd party Ad. Not an offer or recommendation by Investing.com. See disclosure here or remove ads.

Which stock should you buy in your very next trade?

AI computing powers are changing the stock market. Investing.com's ProPicks AI includes 6 winning stock portfolios chosen by our advanced AI. In 2024 alone, ProPicks AI identified 2 stocks that surged over 150%, 4 additional stocks that leaped over 30%, and 3 more that climbed over 25%. Which stock will be the next to soar?

Unlock ProPicks AI
Read Next

Latest comments

Donald TrumpNov 11, 2014, 03:23
I think this is just another confirmation that the days are numbered for the biggest stock market bubble since NASDAQ 2000.
Risk Disclosure: Trading in financial instruments and/or cryptocurrencies involves high risks including the risk of losing some, or all, of your investment amount, and may not be suitable for all investors. Prices of cryptocurrencies are extremely volatile and may be affected by external factors such as financial, regulatory or political events. Trading on margin increases the financial risks.
Before deciding to trade in financial instrument or cryptocurrencies you should be fully informed of the risks and costs associated with trading the financial markets, carefully consider your investment objectives, level of experience, and risk appetite, and seek professional advice where needed.
Fusion Media would like to remind you that the data contained in this website is not necessarily real-time nor accurate. The data and prices on the website are not necessarily provided by any market or exchange, but may be provided by market makers, and so prices may not be accurate and may differ from the actual price at any given market, meaning prices are indicative and not appropriate for trading purposes. Fusion Media and any provider of the data contained in this website will not accept liability for any loss or damage as a result of your trading, or your reliance on the information contained within this website.
It is prohibited to use, store, reproduce, display, modify, transmit or distribute the data contained in this website without the explicit prior written permission of Fusion Media and/or the data provider. All intellectual property rights are reserved by the providers and/or the exchange providing the data contained in this website.
Fusion Media may be compensated by the advertisers that appear on the website, based on your interaction with the advertisements or advertisers.
© 2007-2025 - Fusion Media Limited. All Rights Reserved.