Trump says firing Fed Chair Powell "highly unlikely" unless fraud found
I had a couple of questions yesterday about the 'IHS' that had formed on the ES chart.
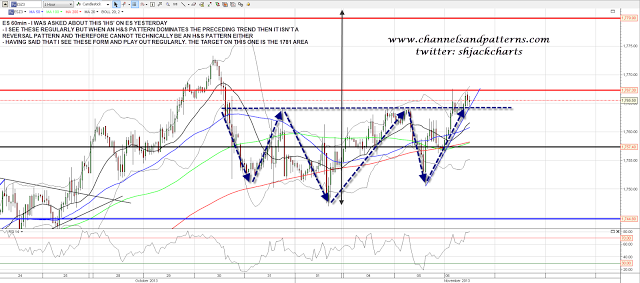
I hadn't been showing this and that's because it isn't actually a valid IHS. Any H&S pattern must be a reversal pattern by definition, and if an H&S pattern occupies a large majority of the trend leading into it then it isn't a reversal pattern. If it isn't a reversal pattern then the historical stats for the performance of these patterns do not apply. I see these form regularly though and while they break the neckline less often they do often make the 'target' after doing so. FWIW the 'target' on this one would be in the 1781 area and it has already broken over the neckline at 1764. ES 60min chart:
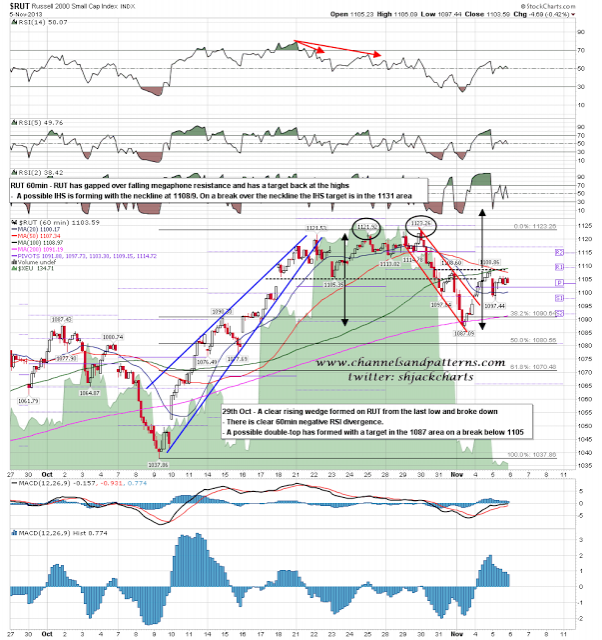
What I have been showing is the possible IHS on RUT. That is a reversal pattern in my view and I've been watching it carefully. If it's going to break up that will need to be today (for symmetry), and the target would be in the 1131 area, somewhat above the current high at 1123.26. If that happens then we may well also see the ES 'IHS' play out to 'target'. RUT 60min chart:
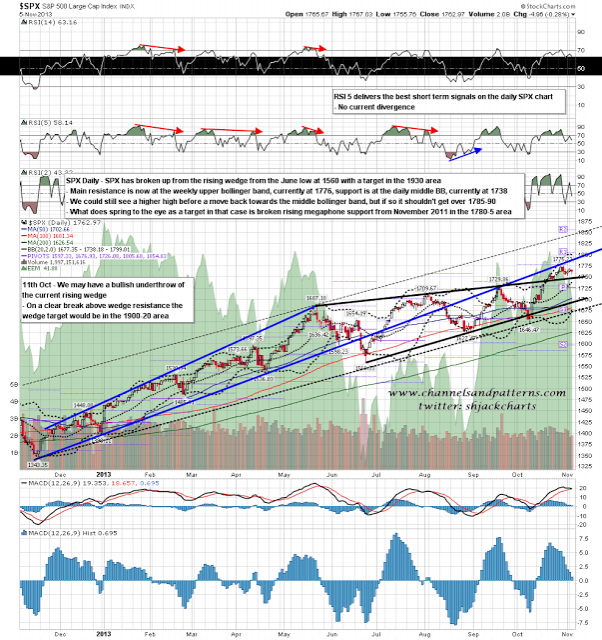
I've been mentioning possibly every day since the current SPX high was made that the high might well be retested and exceeded as part of the current short term topping process, and it seems that time may well be at hand now. If so this should fix the absence of RSI 5 negative divergence on the SPX daily chart that made the current high look doubtful at the time. SPX daily chart:
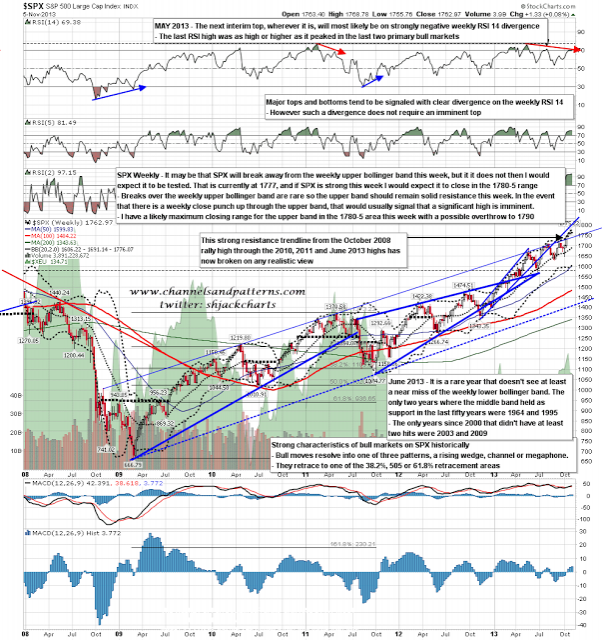
If we are going to see the current highs retested I therefore have a string of levels that are in the same area. The first and second are from the ES chart with the 'IHS target' at 1781 (approx 1786 SPX) and the weekly R2 pivot at 1779.90 (approx 1784.90 SPX). The third is from the SPX daily chart and is the retest of broken rising megaphone resistance from Nov 2012 in the 1785 area, and the fourth is the SPX weekly upper bollinger band, which I would expect to close in the 1780-5 area this week if we see strength on equities today and tomorrow. This is an attractive confluence of targets and also very strong resistance. The ideal high for a move up here wold be in the 1780-5 SPX range and we shouldn't see a close this week any higher than 1790. This is all in the acceptable range for the second high of a double-top. SPX weekly chart:
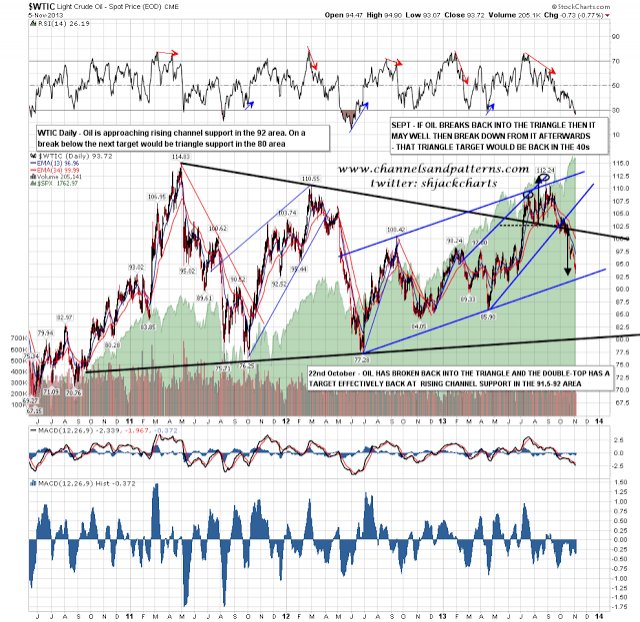
On other market CL is now approaching the test of rising channel support target that I gave on 21st October. That test should be in the 92 area and is very important, as on a break below the next support level will be at triangle support in the 80 area. WTIC daily chart:
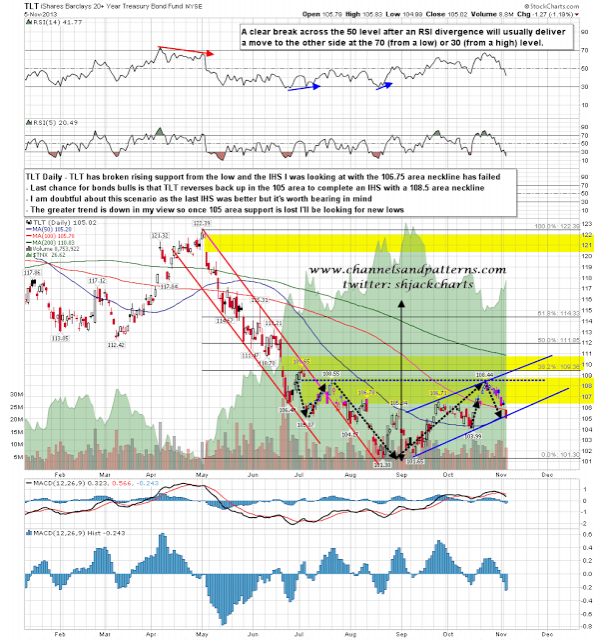
The general view is that QE is positive for bond prices and negative for bond yields. This is entirely contradicted by the bond price action during QE periods over the last few years which shows a very strong correlation in the opposite direction. With seemingly no end to QE in sight it is perhaps not therefore surprising that the rally on bonds has been faltering, failing even to make the initial 110.4 double-bottom target on TLT. The latest IHS I was looking at on TLT has now most likely failed and rising support from the TLT low this year has been broken. The last hope for TLT bulls in my view is that a larger IHS is forming at a 108.5 area neckline but the quality and setup isn't as good as the last one, and it requires TLT to make the right shoulder low in the 104/5 area. Any close below 104 and I will be looking for new lows. The greater trend on my charts is definitely downward in any case. TLT daily chart:
I'll be watching the RUT chart to see whether RUT gaps over the IHS neckline at the open. If so I wouldn't generally expect to see that opening gap fill today and I would be looking for that test of the current highs on RUT and SPX this week, and very possibly today. My ideal target area would be 1780-5 on SPX. The main support level I will be watching today is the weekly pivot on ES at 1757.40 (approx 1762.40 SPX).
Source: Channels and Patterns
Which stock should you buy in your very next trade?
With valuations skyrocketing in 2024, many investors are uneasy putting more money into stocks. Unsure where to invest next? Get access to our proven portfolios and discover high-potential opportunities.
In 2024 alone, ProPicks AI identified 2 stocks that surged over 150%, 4 additional stocks that leaped over 30%, and 3 more that climbed over 25%. That's an impressive track record.
With portfolios tailored for Dow stocks, S&P stocks, Tech stocks, and Mid Cap stocks, you can explore various wealth-building strategies.

