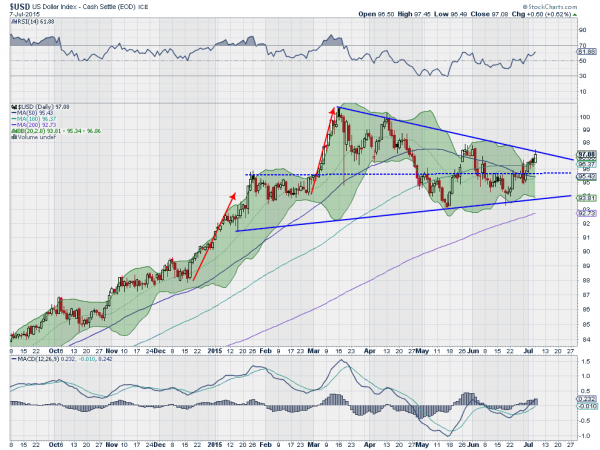
The US dollar broke a range and headed higher in July 2014. The run up to 100 from the long base around 80 was historic. A 25% move higher. Many assumed that when it pulled back that was the end of the move. But that is not how the US dollar moves. It has tended to move in 7 year cycles as I pointed out in The Longer Outlook in….. the US Dollar Index from March. That leaves 6 more years.
And the chart of the US Dollar Index suggests a possible path for how that might now continue. The symmetrical triangle has been building for 6 months. With the latest move higher there is support for a break out with the momentum indicators moving up. The RSI is making a higher high while the MACD is rising and also about to make a new high. With the Bollinger Bands® opening, the entire environment is supportive of more upside.
The Index is also about 2/3 of the way through the triangle, the power zone for a move. A break to the upside would look for a move to 106 initially on the triangle break. But then to 115 on the broader pattern. Are you ready for the next dollar break out?
DISCLAIMER: The information in this blog post represents my own opinions and does not contain a recommendation for any particular security or investment. I or my affiliates may hold positions or other interests in securities mentioned in the Blog, please see my Disclaimer page for my full disclaimer.
Which stock should you buy in your very next trade?
With valuations skyrocketing in 2024, many investors are uneasy putting more money into stocks. Unsure where to invest next? Get access to our proven portfolios and discover high-potential opportunities.
In 2024 alone, ProPicks AI identified 2 stocks that surged over 150%, 4 additional stocks that leaped over 30%, and 3 more that climbed over 25%. That's an impressive track record.
With portfolios tailored for Dow stocks, S&P stocks, Tech stocks, and Mid Cap stocks, you can explore various wealth-building strategies.

