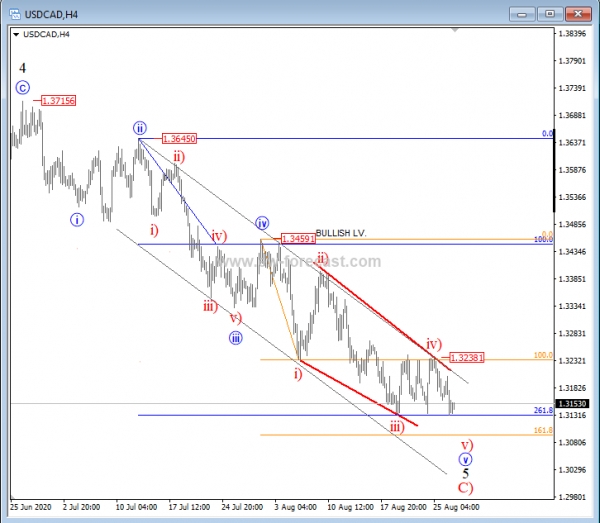
USD/CAD is unfolding a bearish impulse, down from 1.371 level, which can be in the final stages. We specifically see an Elliott wave ending diagonal underway within a blue wave v of 5 that is part of a bigger, bearish impulse, and which can look for a low, support, and a bounce at the 1.313/1.309 level, at various Fibonacci ratios. A later impulsive (in five legs of a lesser degree) recovery, and a break above the upper Elliott wave ending diagonal line, and above the 1.33 mark will suggest a low in place, and a bullish turn in minimum, three waves underway.
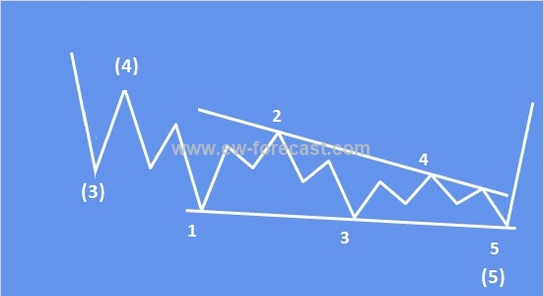
An ending diagonal is a special type of pattern that occurs at times when the preceding move has gone too far too fast, as Elliott put it. A very small percentage of ending diagonals appear in the C wave position of A-B-C formations. In double or triple threes, they appear only as the final “C” wave. In all cases, they are found at the termination points of larger patterns, indicating exhaustion of the larger movement.
- structure is 3-3-3-3-3
- a wedge shape within two converging lines
- wave 4 must trade into a territory of a wave 1
- appears primarily in the fifth wave position, in the C wave position of A-B-C and in double or triple threes as the final “C” wave
Ending diagonal in downtrend:

Which stock should you buy in your very next trade?
AI computing powers are changing the stock market. Investing.com's ProPicks AI includes 6 winning stock portfolios chosen by our advanced AI. In 2024 alone, ProPicks AI identified 2 stocks that surged over 150%, 4 additional stocks that leaped over 30%, and 3 more that climbed over 25%. Which stock will be the next to soar?
Unlock ProPicks AI