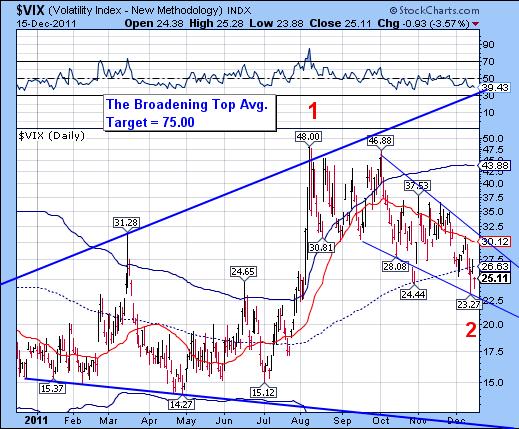
-- The VIX completed a declining wedge pattern and a 1/2 Primary Cycle low on December 13. This may also signal the end of the Master Cycle which began on April 28. The significance of this pattern is that the cycle model anticipates multiple peaks starting December and ending in April. The presumption is that the highest peak in the VIX may occur in April.
This is a huge negative for equities through the same time period.
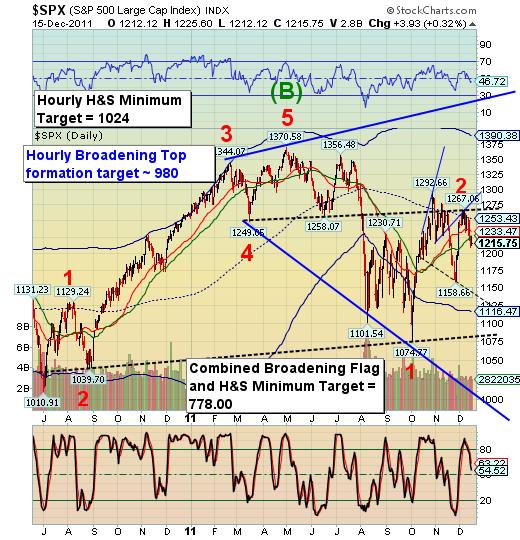
-- SPX retested the underside of its 50 day moving average at 1225.60, then reversed down. There are no further supports for the SPX until it reaches daily cycle bottom support at 1116.47. This may only provide a wiggle to test the underside of the Head and Shoulders neckline at 1135.00. The crossing of the smaller, down sloping neckline gives us a minimum target of 1024.00 and crossing a much more massive neckline at about 1080.00. The chart is very busy, but it are clearly sets out the targets over the next 4 to 6 weeks. I expect 980.00 to 1024.00 to the mat by the end of December.
Few technicians recognize the Broadening Top formation as a pre-crash formation. The real decline may have just begun. By the way, the triangle may have failed.
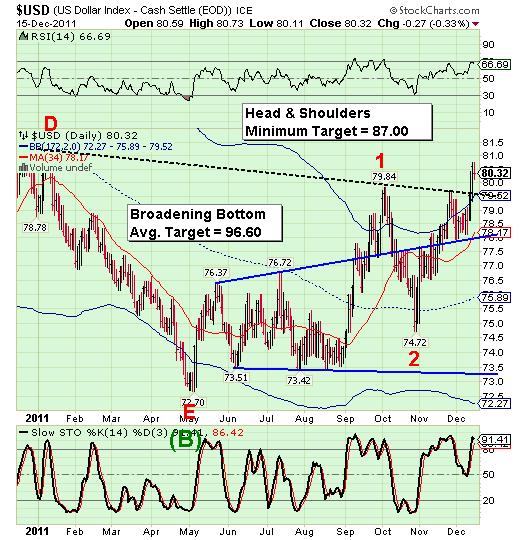
--The USD pulled back today as it retests its inverted Head and Shoulders neckline at 79.50. The dollar remains on a confirmed buy signal since it reversed off mid-cycle support at 75.72 in early November. The cycles model suggests a peak in the dollar occurring next week, with a brief respite through the year end.
3rd party Ad. Not an offer or recommendation by Investing.com. See disclosure here or remove ads.
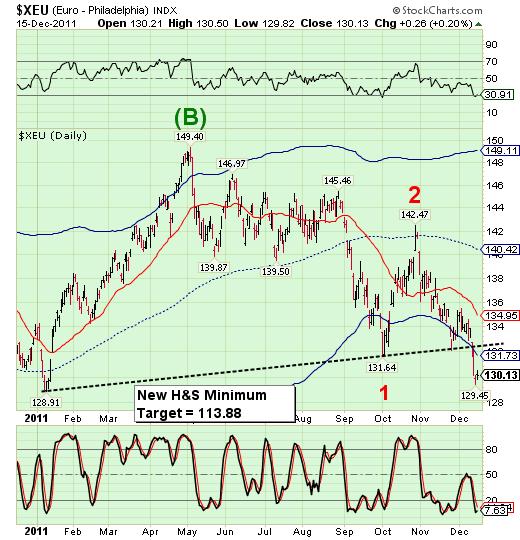
-- Despite its oversold condition, the euro continues its decline towards its Head and Shoulders minimum target of 113.88. Today Russia steps in to ease the EU liquidity shortage through loans to the IMF.
Meanwhile, the UK and France is in a spat about whose economy is worse off. Meanwhile, Italy and Spain appear to be the most PIIGgy about using EF SF money.
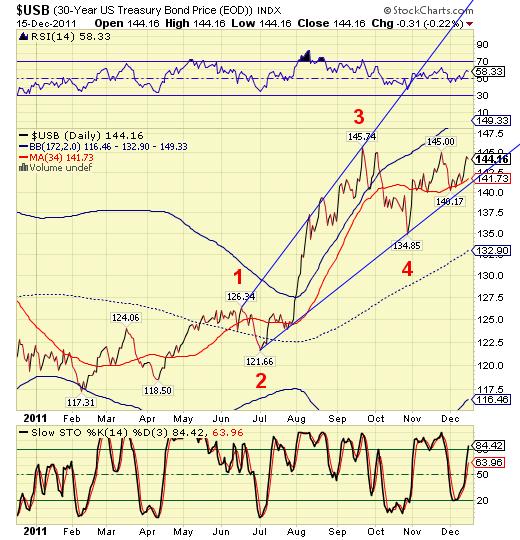
-- USB remains on a buy signal above intermediate-term trend support at 141.73. The cycle model suggests that USB may continue to rally through the end of December.
We may soon see the end of the 30 year uptrend in US treasuries in the near future. However, it appears that the long bond may go out with a (parabolic) bang instead of a whimper.
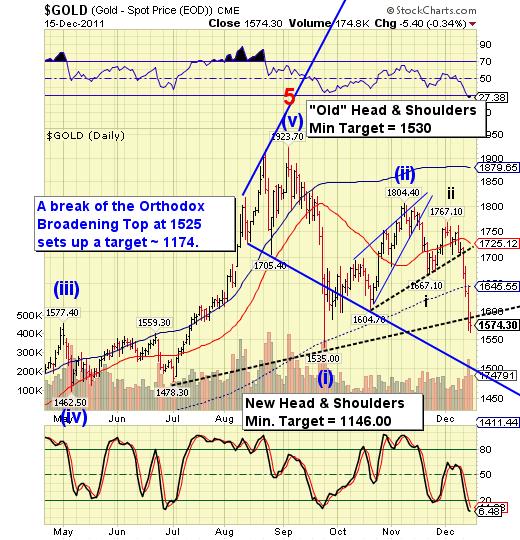
-- Don't look now, but gold may have just reached yet another Head and Shoulders neckline. If that is so, there is a new, more aggressive target than what is being offered by the Orthodox Broadening Top. Remember, once the Head and Shoulders pattern is activated, the success rate of reaching or declining below the 1146.00 or lower is 93% (source: Encyclopedia of Chart Patterns by Thomas Bulkowski, page 290). The Orthodox Broadening Top, which notified us of the potential crash in gold was identified in August. The Head and Shoulders patterns simply confirm what the broadening pattern had already warned us about . In other words, it confirms a high potential for a crash, especially in this combination.
3rd party Ad. Not an offer or recommendation by Investing.com. See disclosure here or remove ads.
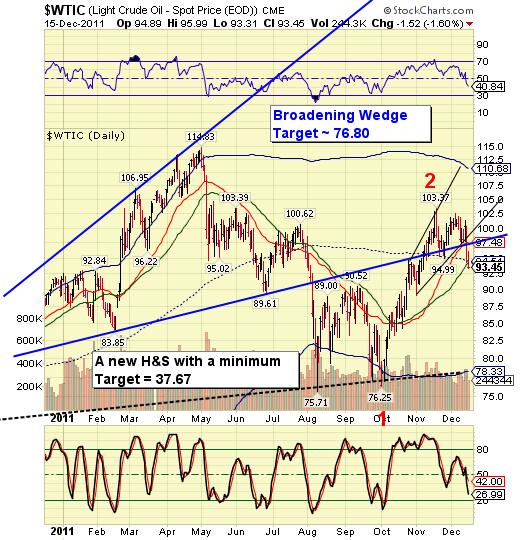
-- West Texas Crude is giving so many sell signals that it's hard to keep track of them all. Today crude broke the 50 day moving average at 94.54 and its mid-cycle support at 54.23. The cycles suggest that crude will break below its massive neckline at 78.33 before the end of the year.
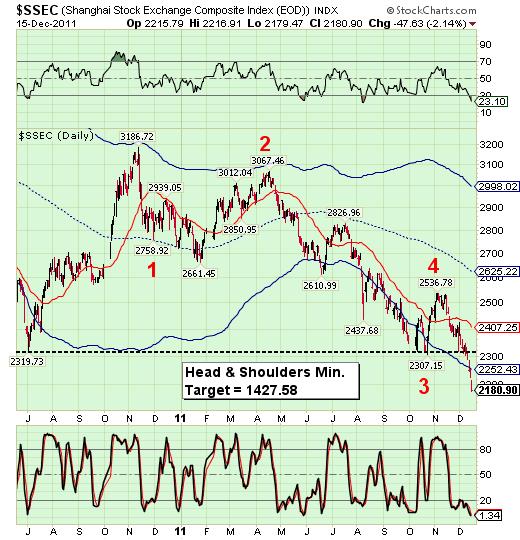
The Shanghai Index violated its October 27 low, which may now be considered as a massive Head and Shoulders neckline. The cycles model suggests that wave (i) of 5 low may appear in late December. The totality of the decline in the Shanghai index may be accomplished by the end of February.
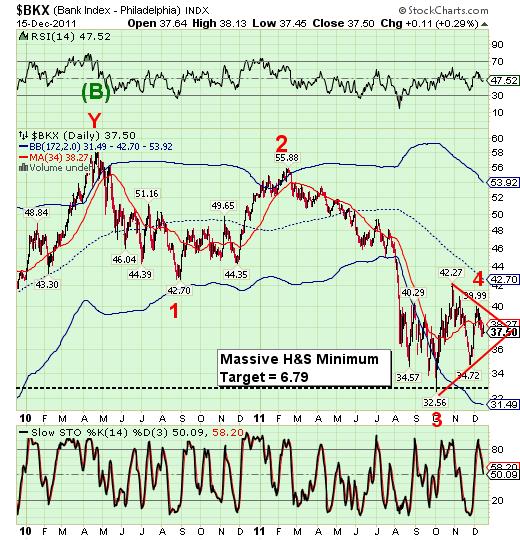
The BKX declined below intermediate-term trend support at 38.27, confirming its reversal sell signal from its most recent high of 39.99. The chart pattern appears to be a triangle with a massive head and shoulders neckline at 32.60. The cycles model suggests that this decline will pierce the neckline, with little or no chance for a bounce until new lows are reached by the end of the year.
Today Fitch announced that it was downgrading eight major banks. (ZeroHedge) According to the Australian Finance Review (link - subscription required), banks down under "have been given 1 week by regulators to stress test how they would handle a spike in joblessness, plunge in home prices spurred by EU debt crisis." Aka a European "Meltdown."
3rd party Ad. Not an offer or recommendation by Investing.com. See disclosure here or remove ads.
(ZeroHedge, again) The Founder of one of the world's largest asset managers, the $30 billion hedge fund BlueCrest, Michael Platt, spoke to Bloomberg TV and cut right to the chase, saying most of the banks in Europe are insolvent and the situation in the region is "completely unstable."
As you can see in the chart, there is a massive Head and Shoulders pattern with the minimum target in the single digits. I wonder how many banks go to zero.
Which stock should you buy in your very next trade?
AI computing powers are changing the stock market. Investing.com's ProPicks AI includes 6 winning stock portfolios chosen by our advanced AI. In 2024 alone, ProPicks AI identified 2 stocks that surged over 150%, 4 additional stocks that leaped over 30%, and 3 more that climbed over 25%. Which stock will be the next to soar?
Unlock ProPicks AI